The distribution of primes

John Harris

New member
Joined
Nov 22, 2012
Messages
22
I played with primes and found pretty patterns. If I describe them, maybe someone can say why it happens.

Take a sequence of primes, p[m], p[m+1] ... p[n-1], p[n]

For each prime excepting p[m], generate the sequence of gapsizes between a prime and its predecessor.

g[m], g[m+1] ... g[n-2], g[n-1]

For each gapsize except g[m], generate the sequence of differences between a gapsize and its predecessor.

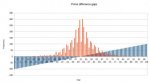
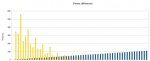
As an example, if the gapsizes are 2, 14, 6, 8, 14, 6, 2, 2 then the differences are 12, -8, 2, 6, -8, -4, 0

Count the number of times each difference appears in the sequence and plot the totals as a barchart.

What you'll see is a density plot of an interference pattern that looks similar to what you'd get out of the double-slit experiment with a coherent source.

As the length of your sequence widens the plot, naturally enough, brightens and shows more fringes.

As you select a higher starting prime, the plot height reduces compared to its width.

I'd not expected to see that sort of distribution when looking at sufficient primes to get probabilistic but that's what I see when I do the procedure.

I'll be interested to read your discussion.
 
There are arbitrarily large gaps between successive primes. For example,

(10^100+1)!+2, (10^100+1)!+3, ...., (10^100+1)!+10^100-2, (10^100+1)!+10^100-1, (10^100+1)!+10^100,(10^100+1)!+10^100+1,

is a list of one Googol consectutive, composite integers
 
Last edited:
Oddly enough my laptop doesn't have enough memory to evaluate sequences in that range, I limited my own exploration to sequences of 20,000 with a maximum magnitude of twenty digits. I'm quite sure the pattern I described extends into your domain though[1].


eta [1]: You'd have to take a sufficiently long sequence for the pattern to emerge, a mere 20,000 wouldn't scratch the surface for numbers even half that size.

("even half that size" is the nearest I can get to humour)
 
Last edited:
Oddly enough my laptop doesn't have enough memory to evaluate sequences in that range, I limited my own exploration to sequences of 20,000 with a maximum magnitude of twenty digits. I'm quite sure the pattern I described extends into your domain though.
John

It does not pay to dispute daon. He is certain to be familiar with the distribution of primes, a subject that has been studied by mathematicians for centuries. Moreover, you can easily prove with pencil and paper that daon is correct. I have never seen him make even a fraction of an error.

\(\displaystyle Let\ n\ be\ a\ whole\ number\ such\ that\ 2 \le n \le (10^{100} + 1) \implies\)

\(\displaystyle \dfrac{(10^{100} + 1)!}{n}\ is\ a\ whole\ number \implies\)

\(\displaystyle \dfrac{(10^{100} + 1)! + 1}{n} = \dfrac{(10^{100} + 1)!}{n} + \dfrac{1}{n} = a\ whole\ number\ plus\ a\ proper\ fraction \implies\)

\(\displaystyle \{(10^{100} + 1)! + 1\}\ is\ prime.\) Shades of Euclid's proof on the infinitude of primes.

\(\displaystyle Also,\ \dfrac{(10^{100} + 1)!}{n}\ is\ a\ whole\ number\ \implies\)

\(\displaystyle \left\{\dfrac{(10^{100} + 1)!}{n} + 1\right\}\ is\ a\ whole\ number \implies\)

\(\displaystyle (10^{100} + 1)! + n = n * \left\{\dfrac{(10^{100} + 1)!}{n} + 1\right\},\ a\ product\ of\ whole\ numbers \implies\)

\(\displaystyle every\ number\ from\ \{10^{100} + 1)! + 2\}\ through\ \{(10^{100} + 1)! + (10^{100} + 1)\}\ is\ not\ prime.\)

That is a googol's worth of consecutive primes, which is a lot.
 
Last edited:
Oddly enough my laptop doesn't have enough memory to evaluate sequences in that range, I limited my own exploration to sequences of 20,000 with a maximum magnitude of twenty digits. I'm quite sure the pattern I described extends into your domain though[1].

eta [1]: You'd have to take a sufficiently long sequence for the pattern to emerge, a mere 20,000 wouldn't scratch the surface for numbers even half that size.

I am not doubting that there are consistencies in the distribution of primes. e.g. \(\displaystyle \pi(x) \sim \dfrac{x}{\log x}\).

However, primes behave nasty when they get big. In addition to arbitrarily large jumps, there are also believed to be an infinite number of twin primes. These, I think will throw off any closed-form "arithmetic patterns". Maybe you can explain the pattern you are describing more concisely?


It does not pay to dispute daon.

Haha, I don't think he was disputing me, just poking fun at my extreme example.
 
Maybe you can explain the pattern you are describing more concisely?
Would that I could. It's an explanation that I'm lacking.

In terms of visualizing it, though I'm hoping someone here might post a graph from Mathematica, it's pretty much the same as any graph or photo of double-slit interference. http://www.paulfriedlander.com/images/timetravel/interference 2.jpg might visualize what I described. It encompasses both twin primes and arbitrarily long gaps.
 
Here, this might help visualize what I was trying to describe.

I've taken the 4,000 primes immediately above 21,000,000 just to get a range with a reasonable range of gaps, in this case between -100 and +100.

The blue bars represent the gap sizes, from lowest to highest. "Gap" has the meaning described in the opening post.

The red bar is the count of the number of times that gap size occurs for that range of primes.

If you consider what you can see, every third red bar is far less likely to occur than the preceding two. The whole fits into an appropriate bell curve but the dip every third bar is what I find fascinating. That's what I'm trying to find a reasonable explanation for, and I'm sure one exists but I can't so far find it or give it. This isn't a futile attempt to discover an impossible formula for primes, it's a search for an explanation of a phenomenon.

The pattern extends to every range of primes I've thrown at it.
 

Attachments

  • mospa12.jpg
    mospa12.jpg
    20.1 KB · Views: 1
John

Based on my admittedly sketchy knowledge of the history of research into prime numbers, the issue is not whether there are patterns in the primes. One of the most familiar is the frequency of primes that differ by 2: 3 and 5, 5 and 7, 11 and 13, 107 and 109. So there are apparent patterns. The problem, as I understand it, is that the patterns are not regular enough for anyone to have found mathematical rules describing them precisely and consequently to have any idea how to explain them.

I'm not seeking mathematical rules describing them precisely but I do think the patterns are explicable on a purely logical basis, if I could decide what it is. I'm of the opinion that it stems from the fact that more numbers in any given range are non-prime because they're factors of 3 than of 5, and 5 than of 7, and 7 than of 11 etc. and that this peculiar distribution is a manifestation of those relationships.

I've not heard of your suggestion that "One of the most familiar [patterns] is the frequency of primes that differ by 2" but I add a plot for the same data of the differences between the primes in the range I selected. The ascending blue markers are each possible difference starting with 2 and going up 4, 6, 8, 10 etc., the yellow shows the frequency with which each difference occurs in the range. Again there's a cycle of three peaks: differences with multiples of 6 are significantly higher than the remainder. Perhaps you could point out on the plot what the familiar pattern of primes that differ by 2 is, I've honestly never heard it mentioned before.
 

Attachments

  • mospa13.jpg
    mospa13.jpg
    20.2 KB · Views: 1
Last edited:
I'm not seeking mathematical rules describing them precisely but I do think the patterns are explicable on a purely logical basis, if I could decide what it is. I'm of the opinion that it stems from the fact that more numbers in any given range are non-prime because they're factors of 3 than of 5, and 5 than of 7, and 7 than of 11 etc. and that this peculiar distribution is a manifestation of those relationships.

I've not heard of your suggestion that "One of the most familiar [patterns] is the frequency of primes that differ by 2" but I add a plot for the same data of the differences between the primes in the range I selected. The ascending blue markers are each possible difference starting with 2 and going up 4, 6, 8, 10 etc., the yellow shows the frequency with which each difference occurs in the range. Again there's a cycle of three peaks: differences with multiples of 6 are significantly higher than the remainder. Perhaps you could point out on the plot what the familiar pattern of primes that differ by 2 is, I've honestly never heard it mentioned before.
John

I am not a mathematician and tried to warn you that my knowledge is sketchy. Your graph is interesting, and I have no ideas on how to explicate it. I will say, however, looking at your patterns, there is an apparent cycle of frequencies, namely

difference of 6n > difference of 2n > difference of 4n.

Furthermore, the mean frequency of the cycle decreases as n increases.

If these patterns prevail over all sufficiently large ranges (and obviously no one can ever know that by experimentation), then a difference of 2 is only the second most frequent difference between primes.

However, I believe that the frequency that I have seen mentioned elsewhere is the frequency of differences between contiguous primes (a constraint I apologize for not mentioning in my previous post). That is, taking the primes from 1 to 30, we get this distribution

Difference of 1: (2, 3) gives a frequency of 1 out of 9 possible differences between the 10 contiguous primes, or 11%.
Difference of 2: (3, 5), (5, 7), (11, 13), (17, 19) gives frequency of 4, or 44%.
Difference of 4: (7, 11), (13, 17), (19, 23) gives a frequency of 3, or 33%.
Difference of 6: (23, 29) gives a frequency of 1 out of 9, or 11%.

This of course is a very small range, and a difference of six is feasible only starting with pairs of primes starting at 7 so it is not a valid experiemnt. I just used it to illustrate the point.

I do not know how you constructed your plot, whether you restricted it to contiguous primes or not. If you did, then it is interesting (but not necessarily surprising) that differences of two are the second most frequent, and differences of six are the most frequent, over the range of large primes that you analyzed.

You have now exhausted my knowledge on this topic.
 
Top