loungeroom
New member
- Joined
- Oct 28, 2016
- Messages
- 3
Hello everyone,
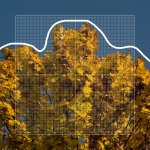
I am undertaking a photography project at university to overlay curved graphs from equations onto the pattern of the subject in the picture.
I have zero mathematics skills and I have been trying to use Desmos to overlay a curve graph over an image. I can get so far in creating curves from sin/cos and using sliders to fine tune where I want the curved line to go, however my question is:
Is there a way to create a curve function from a list of points on the grid and output it as a function?
I have provided an example of a badly drawn curve on the picture.
Thank you, Bob