Isosceles Triangle Probability: A spread of five random points produce only scalene triangles when any three points are joined.

Mark Paxton

New member
Joined
Oct 18, 2020
Messages
11
A spread of five random points produce only scalene triangles when any three points are joined. When a sixth random point is added a total of five isosceles triangles are created with the first five points (allowing a tolerance of +/- 0.5 % on the leg lengths). Is it possible to calculate the probability of this happening?
Thank you.
Please show us what you have tried and exactly where you are stuck.

Please follow the rules of posting in this forum, as enunciated at:


Please share your work/thoughts about this problem
 
A spread of five random points produce only scalene triangles when any three points are joined. When a sixth random point is added a total of five isosceles triangles are created with the first five points (allowing a tolerance of +/- 0.5 % on the leg lengths). Is it possible to calculate the probability of this happening?
Thank you.
One difficulty here would be to define "random points". Are they chosen randomly from the entire plane, or from some restricted area? Using what distribution? And I assume the scalene-ness is subject to the same tolerance?

Assuming this is not an assignment, but your own idea, you might start by considering a smaller problem: Given two random points, find the probability that a third would form an isosceles triangle with them. Then work up.
 
Thank you both for your response. I am afraid I am not a mathematician and this problem arises from a study of Neolithic monuments. A computer programme was written some years ago indicating that the probability of an isosceles triangle between three random points (+/- 0.5% of the leg lengths) is about 3%. It is beyond my ability to calculate for five isosceles triangles as described, not least because all five triangles share one corner. Hence, this is where I am stuck.

The five random points referred to are all on the summits of hilltops found on the 1:25000 OS Map of the Marlborough Downs in Wiltshire. These include the two highest points in Wiltshire and three neighbouring high points. The sixth point is a Neolithic standing stone (The Obelisk now destroyed) at Avebury, and was the tallest stone in the complex.

So I am stuck with the problem of estimating the probability that The Obelisk was located at random.

The picture shows the location of the five high points defined by the OS Map and the location of The Obelisk, the most northerly point, forming the five triangle corners. I have checked these distances using an online Vincenty programme and they are all accurate to +/- 0.5% of the triangle leg lengths. These distances are very close to those given by Google Earth’s ruler.

I believe the probability of the Obelisk being located at random will be a low number and if so this will support the late Professor Thom’s assertion that the Neolithic people were surveying the landscape with skills akin to his own.

I realise this is an unusual request and please pardon me if it is out of place on this forum.

maths.jpg
 
There are a total of five isosceles triangles and each one has a corner on the northern point.
 
Please name the vertices A, B, C, D, E & F (as shown ) and then name the isosceles triangles.
It would also help if the OP posted their measured distances between every pair of points. My crude attempt found only 3 triangles with 0.5% tolerance, and two with tolerances under 0.8%:
  1. AF,DF 0.164%
  2. AE,CE 0.125%
  3. AB,DB 0.135%
  4. AC,AD 0.739%
  5. AD,ED 0.778%
 
A computer programme was written some years ago indicating that the probability of an isosceles triangle between three random points (+/- 0.5% of the leg lengths) is about 3%.
I would like to see the details of that calculation; it presumably makes some additional assumptions.

The probability you ask for, even after some clarifications, is probably too hard to work out in general, but could conceivably be done by computer given the locations of the five known points.

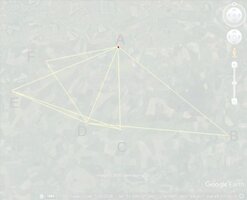
There are a total of 10 possible triangles that could be formed with the new point A, so your claim is that half of the triangles formed are isosceles, with random location of apex as well. So there are something like 30 possible places to put your five isosceles triangles, increasing the probability considerably from what you might expect. One could conceivably mark regions where A could be located to make each of these 30 potential triangles isosceles, and then identify regions where at least five of these intersect. Find their areas, and you have the answer (if you have identified a region in which A is supposed to be randomly chosen).
I believe the probability of the Obelisk being located at random will be a low number and if so this will support the late Professor Thom’s assertion that the Neolithic people were surveying the landscape with skills akin to his own.
But such a probability doesn't really tell you anything; assigning meaning to such an after-the-fact probability calculation is very tricky. See here. If the probability of five isosceles triangles is low, that doesn't imply that the probability that the location was chosen randomly is low. And how do we know that the five high points you chose are the only relevant ones?

My main question is not mathematical. It is this: Why would they want to make randomly oriented isosceles triangles; and how in the world, if you wanted to accomplish this even today, would you accomplish this? That would amount to finding one of the regions I mentioned as part of finding the probability; I'm not sure a modern surveyor would take on the challenge.

I'd be much more likely to want to help support your theory if I could imagine a motivation for all the work it would take neolithic people to figure this out.
 
For whatever this is worth, my quick-and-dirty script found 25 points in this 417x338 image using the 1% tolerance, i.e. the probability of about 0.018%. This probability would double if we only considered random points in the upper half of the image.
The same script found no points for the 0.5% tolerance.

Disclaimer: this is a pretty crude approach. I only looked at the points with integer coordinates inside the image, but for high precision /low tolerance there is a chance that I could miss some points with non-integer coordinates (although I would not expect too many of those).
 
I've fixed a bug in my script, which reduced the number of points to 5, all at or next to point A (marked by red in the attached image). Thus the probability for 1% tolerance seems to be about 0.0035% if the whole area is considered, or twice that if only the upper half is allowed.
 

Attachments

  • 042c.jpg
    042c.jpg
    29.7 KB · Views: 3
Thank you very much blamocur that is the sort of figure I was looking for.

Thank you Khansaheb, Dr Peterson and blamocur for your responses and your advice on this subject. I will try to respond to the points.

Regarding the isosceles vertices in the image you posted khansaheb and the measured distances blamocur asked for.

A The Obelisk

B Martinsell Hill

C Milk Hill

D Tan Hill

E Morgans Hill

F Cherhill

Milk Hill and Tan Hill differ in height by less than a meter. These are the two highest summits in Wiltshire. The two highest summits to the west of these are Cherhill and Morgans Hill and Martinsell Hill is the highest summit to the east.

Isosceles triangles (+/-) are created between these points as follows with the apexes as the central figure shown in bold:

DAC ABD CEA EDA AFD

Distances.

These are measured on Google earth. A very similar result is given using Vincenty so I have used Google earth throughout. These measurements are taken between the point heights on these summits defined by The Ordnance Survey map and transferred to Google Earth. The only exception is Milk Hill where the summit area is defined by a contour and no point height. All these summit areas are relatively flat and it is difficult to define a precise summit on any of them by eye.

For the initial triangle DAC between the two highest summits and The Obelisk I used the distance between the Obelisk and the Trigonometric Pillar (Trig Point) on Tan Hill which is visible on historic images on Google earth, this distance is 5620m. The same distance measured from The Obelisk to Milk Hill gave a geometric point within a few meters of the summit closed contour. Using Google earth’s “elevation profile” this is within a few metres of the highest point. The high ground up here undulates.

Having established points D and C in this way the following measurements result using the Ordnance Survey summit point heights and visible trig points, and Google earth’s meter ruler.

DA 5620 AC 5620

AB 9666 BD 9686

CE 7902 EA 7927

ED 5657 DA 5621

AF 5057 FD 5072

Using Google earth’s meter ruler it is possible to create five exact isosceles triangles with The Obelisk using geometric points located on the summit areas of each of these five hills. Google earth images are not reliably accurate within fifteen metres in this area, furthermore it is possible the trig point on Morgans Hill may be fifty meters from the precise high point in order to achieve a better view of other trig points. In other words when hill summits like these are relatively flat the precise high point is not easy to define, and may itself be an area, rather than a point. However, the figures above are exact measurements using the Ordnance Survey and Google earth to the best of my ability.

Thank you for your response, Dr Peterson. A maths teacher called Oliver Bentham wrote the computer program years ago and kept revising it. He used a tolerance of 1% on the leg lengths and the result was about 3% for the probability of an isosceles triangle between three random points. He revised the program several times and the result was always about 3% probability. I no longer have the version he sent me, I will ask him to forward it to you (if he still has it) if you are interested.

Regarding “after the fact”, this is certainly the case when investigating Neolithic monuments. However, if The Obelisk was intentionally placed at this geometric point in the landscape it would obviously require an exceptional ability to measure topography and to calculate.

But as you say the crux of the issue is, Why would they want to make isosceles triangles like this.

There is a repeating pattern between the locations of the largest Neolithic monuments in Britain. They all align with extreme topographical points, and when these points are joined together they form isosceles triangles. The result is a series of examples of high points and coastal extreme points that are geometrically ordered. I can send you a series of examples of this if it is of interest. Ancient monuments aligning with a handful of seemingly random extreme points which, when joined together, form isosceles triangles. The purpose appears to be to identify geometry in topography.

One good example identified by alignments from both Stonehenge and Stanton Drew is the near perfect isosceles triangle between three national high points in the British Isles, Snaefell, Ben Nevis, and Scarfell Pike. The repetitious nature of these alignments and the resulting topographical geometry gives pause for thought.
 
Top