You are using an out of date browser. It may not display this or other websites correctly.
You should upgrade or use an alternative browser.
You should upgrade or use an alternative browser.
Reducing non linear laws to linear form
- Thread starter Yuseph
- Start date
The idea here is that the given data values are almost certainly erroneous (faux), but by a small and random amount.
(Alternatively, the data values given are exact but not fully explained by the process that is dominant. It is similar to calculating a trajectory while ignoring air resistance or the speed of the earth's rotation.)
The mathematics is messy so most of us use a computer. We calculate a simple line or curve in such a way as to minimize a measure of error (usually the sum of the squared errors) between the calculated result and the given data. We then should analyze the errors (though if the measure of error is small, this step is frequently skipped) before concluding that the result is good enough.
A different way to say it is that "regression analysis" is a way to come up with simple models that seem to be reasonably good.
I know nothing about machine learning.
The math of linear regression itself is not approximate except in the sense that the number of digits is limited. In all probability, the data is not perfect, which means you cannot get exact numerical answers. Interpreting whether the results are "good enough" calls for mathematical sophistication that I do not have.
The math of linear regression itself is not approximate except in the sense that the number of digits is limited. In all probability, the data is not perfect, which means you cannot get exact numerical answers. Interpreting whether the results are "good enough" calls for mathematical sophistication that I do not have.
Dr.Peterson
Elite Member
- Joined
- Nov 12, 2017
- Messages
- 16,087
Can you explain more fully what doesn't make sense to you? I'm not sure what you mean by "lose their equilibrium".Yo guys,
This exercise doesn't make sense to me at all. Ive learnt that equations must not lose their equilibrium. And now i see this.
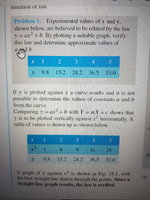
The main idea is that if you know y is a linear function of x^2, in this case ax^2 + b, you can make a new variable, say u = x^2 (your source uses X), so that y is a linear function of u. Then when you plot y against u, you can use either exact methods or linear regression to find an equation for y.
Yuseph
Junior Member
- Joined
- Aug 5, 2020
- Messages
- 68
I understood the how we do it but not the why we do it.
Why would we invent fake values and get a gradient of other values ? Say x represent the number of youtube videos posted online. And y the number of new subscribers. Why would I change the real values of x and corrupt the results. Unless it's the opposite and we're only talking about results that we assume as false and those have to be matched with a law that holds true all the time.
Why would we invent fake values and get a gradient of other values ? Say x represent the number of youtube videos posted online. And y the number of new subscribers. Why would I change the real values of x and corrupt the results. Unless it's the opposite and we're only talking about results that we assume as false and those have to be matched with a law that holds true all the time.
Dr.Peterson
Elite Member
- Joined
- Nov 12, 2017
- Messages
- 16,087
I understood the how we do it but not the why we do it.
Why would we invent fake values and get a gradient of other values ? Say x represent the number of youtube videos posted online. And y the number of new subscribers. Why would I change the real values of x and corrupt the results. Unless it's the opposite and we're only talking about results that we assume as false and those have to be matched with a law that holds true all the time.
Who is changing values of x? Where are there any fake values? I don't think you are fully understanding what is being done.
I've explained what it is, and no one is changing x. Another variable is being introduced to represent x^2, because we are told that y is a linear function of x^2. By graphing y as a function of this temporary variable, not x, we can see whether the data fit the equation.
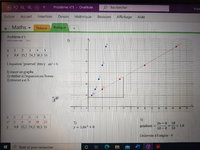
It is confusing because they have put two graphs on the same axes, one (the parabola) treating the x-axis as x (as it should), while the other (the line) treats values on the x-axis as values of x^2, without renaming it. With experience I can understand that (though I've much more often see two different scales for y), but you're new to the idea, so they should have drawn two separate graphs (at first, at least) to make it clearer what they mean.
Yuseph
Junior Member
- Joined
- Aug 5, 2020
- Messages
- 68
Is the reason why you think someone else plotted the graph because it rather comes off as amateur work by a pro or as professional work by an amateur ? 
Anyway i wanted to finish all exercices to make sure i can put all the pieces together.
Im definitely ok with how to do it. Its easy.
But I cant understand the why if I cant systemize.
What you said makes more sense to me now.
Plz correct me if im wrong.
It starts with the previous chapter : it's impossible to get a straight line graph without an equation of the form y = ax + b. However some measurements even though they seem related by a law of propotionality can only be plotted in a non linear way (usually because they're false or too approximate). And because they re non linear their axis intercept and gradient cannot be deducted. i kinda understood that part before. What gave me a hard time is the replacement part. Well i got that part too now. It has to do with interpolation and extrapolation. not fake values. It obviously needs a linear graph to determine other values that have not been measured yet. So this replacement thing is used as a way of looking down to all values measured or not measured from a different angle where the whole thing appear as straight. Its pretty much like trying to determine earth distances if you looking to earth from the outer space. You cant. The curved form would mess your calculations. Youve got to take "straight" measurement from the ground - Sorry its the only metaphor i found- I got the idea but there are still missing pieces.
- can we extrapolate without using a straight line graph or is it the only way ?
- all the exercices i did refered to a particular equation, some of which were scientific, but what if im doing data analysis, and a law hasnt been established yet, and when established it is in no way relating to the forms seen in this chapter ?
y=ax^2 + b
y= a(1/x) + b
y/x = ax + b
y = ax^n
y = ab^x
y = ae^bx
These equations, is that it ? is linear regression only about those equations or should I expect more ?
D
Deleted member 4993
Guest
There are many more "seen and unseen" relations need to be covered - e.g. logarithmic, sine, cosine, sinehyperbolic, etc.Is the reason why you think someone else plotted the graph because it rather comes off as amateur work by a pro or as professional work by an amateur ?
Anyway i wanted to finish all exercices to make sure i can put all the pieces together.
Im definitely ok with how to do it. Its easy.
But I cant understand the why if I cant systemize.
What you said makes more sense to me now.
Plz correct me if im wrong.
It starts with the previous chapter : it's impossible to get a straight line graph without an equation of the form y = ax + b. However some measurements even though they seem related by a law of propotionality can only be plotted in a non linear way (usually because they're false or too approximate). And because they re non linear their axis intercept and gradient cannot be deducted. i kinda understood that part before. What gave me a hard time is the replacement part. Well i got that part too now. It has to do with interpolation and extrapolation. not fake values. It obviously needs a linear graph to determine other values that have not been measured yet. So this replacement thing is used as a way of looking down to all values measured or not measured from a different angle where the whole thing appear as straight. Its pretty much like trying to determine earth distances if you looking to earth from the outer space. You cant. The curved form would mess your calculations. Youve got to take "straight" measurement from the ground - Sorry its the only metaphor i found- I got the idea but there are still missing pieces.
- can we extrapolate without using a straight line graph or is it the only way ?
- all the exercices i did refered to a particular equation, some of which were scientific, but what if im doing data analysis, and a law hasnt been established yet, and when established it is in no way relating to the forms seen in this chapter ?
y=ax^2 + b
y= a(1/x) + b
y/x = ax + b
y = ax^n
y = ab^x
y = ae^bx
These equations, is that it ? is linear regression only about those equations or should I expect more ?
"...what if im doing data analysis, and a law hasnt been established yet..."
- that is what you should be able to do as a research-scientist, engineer, etc. If you only did what has been done before - you would be a low level technician!
"when established it is in no way relating to the forms seen"
For an interesting and fruitful career that is what happens - you hope!
I find myself not quite grasping what your question is really about.
Circumstance 1: I have data points that appears to be almost linear over a certain range, and I know that the data is perfect or close to perfect. I cannot find a mathematical model that is both exact and reliable (degrees of freedom). In that case, I can use linear regression to find a linear approximation for that range.
Circumstance 2: I have data points that are definitely not linear over a certain range, and I know that the data is perfect or close to perfect. I can use linear regression to experiment with non-linear models until I find one that looks best for the range (taking into account degrees of freedom).
Circumstance 3: I have data points that I do not know to be perfect or even close to perfect. I can use linear regression to test mathematical models (including linear models) to see which one seems most robust (taking into account degrees of freedom).
Circumstance 4: I have data points that I do not know to be perfect or even close to perfect. But there are theoretical reasons to believe that a certain mathematical model is appropriate (at least as an approximation). I can use linear regression to test that theory.
I do not see how one analogy can fit such different situations. Linear regression is a tool to create an equation that approximates observed data while minimizing a measure of error. Ultimately, regression involves dealing with data that is faulty, incomplete, or both and trying to make sense out of it. Thinking about it in the idealized way typical of most of mathematics, where everything is assumed to be exact, will drive you nuts
I have mentioned degrees of freedom several times. Here is the basic idea. If I have n observations, I can ALWAYS find a mathematical model that fits the data exactly. Unfortunately, that means none of my data can be used to test the resulting mathematical model. I have no reason to have any confidence in it because it has not been tested. So there is a balance to be struck between the degree of precision achievable in an approximation and the degree of confidence that you can have in the results.
Yuseph
Junior Member
- Joined
- Aug 5, 2020
- Messages
- 68
Thanks guys,
I think you answered the last question i was about to ask. I wondered why in the first 3 exercices the author picked a particular equation instead of another in order to come up with a straight line. I couldnt explain how hed make his choice. For example in exercice 1 why y = ax^2 + b and not another equation ? How did he know itd get him a straight line ?
I think you answered the last question i was about to ask. I wondered why in the first 3 exercices the author picked a particular equation instead of another in order to come up with a straight line. I couldnt explain how hed make his choice. For example in exercice 1 why y = ax^2 + b and not another equation ? How did he know itd get him a straight line ?
In the real world, you don't know. You have some data, and you experiment.
And I'd never start by experimenting with [MATH]ax^2 + b[/MATH].
I'd start with [MATH]ax^2 + bx + c[/MATH].
The probable reason they didn't is that they have not talked yet about multiple regression.
This is a tool for exploring.
EDIT: Oh the technique will give you a straight line. But it may not be reliable.
Dr.Peterson
Elite Member
- Joined
- Nov 12, 2017
- Messages
- 16,087
In general, that would be because you have some theoretical reason to expect that form. In exercises, it would be because the author created the data that way.Thanks guys,
I think you answered the last question i was about to ask. I wondered why in the first 3 exercices the author picked a particular equation instead of another in order to come up with a straight line. I couldnt explain how hed make his choice. For example in exercice 1 why y = ax^2 + b and not another equation ? How did he know itd get him a straight line ?