You are using an out of date browser. It may not display this or other websites correctly.
You should upgrade or use an alternative browser.
You should upgrade or use an alternative browser.
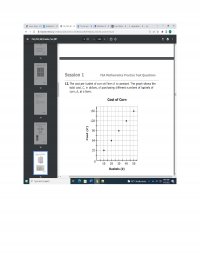
The cost per bushel of corn at Farm A is constant. The graph shows the total cost, C, in dollars, of purchasing different numbers of bushels of corn..
- Thread starter eddy2017
- Start date
eddy2017
Elite Member
- Joined
- Oct 27, 2017
- Messages
- 2,525
I havethe cost on the y-axis and the number of bushels on the x-axis.
I need to find the phrase that represents the independent variable
The phrase that represents the dependent variable
The equation represents the graph.
I see that I have been given the cost per bushel is constant so each bushel is going at the same price.
what I see here is that when I divide the cost of the bushel by the amount I see that is proportional because
32/10=3.2
64/20=3,2 and so forth and so on...
[math]C=p * x[/math]where C=total cost
p= price per bushel
x=number of bushels
So I see the higher the cost the higher of number of bushels so the increase is directly proportional.
but I am not getting the independent or dependent variable.
I have read online that
The independent variable belongs on the x-axis (horizontal line) of the graph and the dependent variable belongs on the y-axis (vertical line).
so that means that b (number of bushels ) is the independent variable here?
and that c (cost per bushel of corn) is the dependent one?
I am in doubt as to the equation that represents the graph
thanks for any help
Last edited:
eddy2017
Elite Member
- Joined
- Oct 27, 2017
- Messages
- 2,525
Taking a second look I think b is the dependent variable. there is a fixed price per bushel that does not change,
on the other hand, C(b) is the total cost depending on b.
Is this analysis of the graph correct or am I missing something here?.
on the other hand, C(b) is the total cost depending on b.
Is this analysis of the graph correct or am I missing something here?.