DownNAbbey
New member
- Joined
- Oct 20, 2017
- Messages
- 3
The exercise provides answers but I am not reaching the same solution for the rejection region.
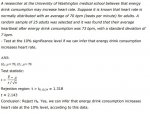
A researcher at the University of Washington medical school believes that energy-drink consumption may increase heart rate. Suppose it is known that heart rate is normally distributed with an average of 70 bpm (beats per minute) for adults. A random sample of twenty-five adults was selected and it was found that their average heartbeat after energy-drink consumption was 73 bpm, with a standard deviation of 7 bpm.
Test at the 10% significance level if we can infer that energy-drink consumption increases heart rate.
Answer:
\(\displaystyle H_0\, :\, \mu\, =\, 70,\, H_1\, :\, \mu\, >\, 70\)
Test statistic:
\(\displaystyle t\, =\, \dfrac{\bar{X}\, -\, \mu}{\left(\frac{s}{\sqrt{n\,}}\right)}\)
Rejection region:
\(\displaystyle t\, >\, t_{0.10,24}\, =\, 1.318\)
\(\displaystyle t\, =\, 2.143\)
Conclusion: Reject H0. Yes, we can infer that energy-drink consumption increases heart rate at the 10% level, according to this data.
I don't quite grasp the formula for finding the rejection region. Thanks for the help if you can.
Attachments
Last edited by a moderator: