marbiostud
New member
- Joined
- Oct 25, 2017
- Messages
- 1
Hi,
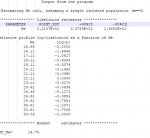
I am writing an assignment where one task is to state the estimated effective population size (POINT_EST and Log (L) 0.0000) (see attached).
I also have to state the 95% confidence intervals (+/-95%CI and Log (L) -2.0000).
I don't understand how to state the confidence intervals? Just as the numbers they are (15.65, 33.76 - respectively)?
I then have to plot the effective population size and the confidence intervals. Do I do this as a point value (effective population size) with error bars (confidence intervals)? Or something else?
Any help much appreciated.