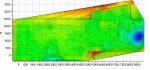
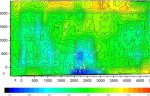
Hello all, I'm looking for some expert advice to create a computational algorithm that will tell me the best way to "treat" a super flat floor. First some background: I am a concrete floor grinder and polisher. There exist today large grinding machines that can run over a concrete floor and grind and polish to a high degree of luster and shine. My current project however is grinding a concrete floor to a very high tolerance of flatness. I am American but live and run my business in France. I've been contracted by a French nuclear research facility to offer an alternative to their precision marble floors. The scientists here use very heavy neutron capture tools that need to be moved by hand. They acheive this by putting their machines on metal disks that emit a stream of presurized air underneath which creates enough force to lift the device a few tenths of a millimeter off the floor. They can then push the object into the new desired position, cut the air and it re-sits on the floor. These devices being moved often weigh several tons. A constraint of this system is that the floor must be incredibly flat, or the floating metal disks will catch on the slightest disparities in the floor. So I have taken on the challenge of grinding this floor to a flatness of 1/10th of a millimeter over ten centimeters, over a surface area about 30 m² (275 sq ft). I am able to scan the surface of the concrete floor with an incredibly precise laser scanner. This gives me a cloud of data points, x,y,z. I then input this data into OriginPro and create a contour map, just like the maps cartographers and geologists use. This map gives me a visual of all the high and low spots, as well as the contours and rate of change over distances of the floor. I would now like to take this data one step further and interpret it in the constraints of the flatness required so that I can generate a second contour map that will indicate to me where I need to concentrate my grinding in order to fall within the tolerance of 1/10 mm over 10 cm for the entire surface, and what would be the most efficient and fastest way to treat the floor to fall within these specs. If you or anyone you know has the mathematical capability to write such an algorithm and would be interested in learning more about the project (to my knowledge this has never been done on an open space) please don't hesitate to contact me and I will provide more detailed info. Thanks so much for taking the time to read through my post. Hope to hear from you soon! ")