Help with problem: Identifying distribution

japam

New member
Joined
Oct 27, 2013
Messages
3
Hi, I've been having trouble with the problem in the image below. I might be over-thinking it, but if anyone could help me with a) and b) it would be really appreciated. Thank you!

View attachment 3379
 
Hi, I've been having trouble with the problem in the image below. I might be over-thinking it, but if anyone could help me with a) and b) it would be really appreciated. Thank you!

View attachment 3379
Invalid atachment, so we can't see the problem. Also, wityhout seeing your thoughts, it is impossible to know if you are over-thinking. Please show us your work!
 
Invalid atachment, so we can't see the problem. Also, wityhout seeing your thoughts, it is impossible to know if you are over-thinking. Please show us your work!

Hi, thank you for your prompt response. The image I was attempting to upload can be seen in the link below (I have also re-attached the file):
http://i792.photobucket.com/albums/yy203/japamisation/stats_zpse7565bdf.jpg?t=1382907145

For question a), I am confused as to how to "identify the population distribution" from the information given. By "population distribution," are they simply asking if the population is right-skewed, normal, left-skewed, etc.? Or is the question asking for an actual numerical value? For this question, I assume my confusion is primarily a matter of semantics. Also, the mean and standard deviation are actually given in the equation itself, correct?

For b), the same question as above applies -- how can I identify the sample data distribution? Is the answer numerical, or simply asking if the distribution right skewed, left-skewed, etc.? If the latter, then would the data distribution be normal, given that the sample involves more than 30 families?

For c), how can I identify the sampling distribution of the mean with the information given? Further, how could I identify its mean? To calculate the standard error, I assume that I simply need to divide the standard deviation of the population by the square root of the number of families -- is this correct?

Again, thank you for your time.
 

Attachments

  • stats.jpg
    stats.jpg
    32.1 KB · Views: 0
I think I was over-thinking what this question was asking, and it might have been easier than I thought this whole time. But I might still be wrong. Here are my answers:

a) Population = right-skewed
Mean = 5.2
SD = 3

b)Sample data = (Here is the only part where I'm still confused. How do I know how the sample data is distributed from the information given?)
Mean = 4.6
SD = 3.2

c) Sampling distribution of mean = Normal (since the sample has more than 30 families)
Mean = 5.2 (I believe the mean of the sampling distribution of the mean is the same as the population mean).
Standard Error = .5 (I calculated this by diving the standard deviation of the population by the square root of 36)
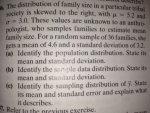
a) is specified to be the "true" population distribution.

b) the numbers are the observed mean and standard deviation, which is all the observer has as estimators of the population distribution. The frequency plot might indicate the skewness of the "true" distribution, but it doesn't matter.

c) You have described the "true" distribution for samples of size N=36.
However, from the observed statistics your estimate of the distribution of samples of size 36 would be mean=4.6 and sigma=0.53.
 
Top