zolton5971
New member
- Joined
- Dec 1, 2014
- Messages
- 11
I need help with this question! The graph is in the picture below!
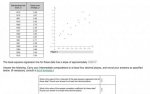
A popular, nationwide standardized test taken by high-school juniors and seniors may or may not measure academic potential, but we can nonetheless examine the relationship between scores on this test and performance in college.
We have chosen a random sample of fifteen students just finishing their first year of college, and for each student we've recorded her score on this standardized test (from
 to
to
 ) and her grade point average (from
 to
to
 ) for her first year in college. The data are shown below, with
 denoting the score on the standardized test and
 denoting the first-year college grade point average. A scatter plot of the data is shown in Figure 1. (This part is above the picture below)
The least-squares regression line for these data has a slope of approximately
 .Answer the following. Carry your intermediate computations to at least four decimal places, and round your answers as specified below.
A popular, nationwide standardized test taken by high-school juniors and seniors may or may not measure academic potential, but we can nonetheless examine the relationship between scores on this test and performance in college.
We have chosen a random sample of fifteen students just finishing their first year of college, and for each student we've recorded her score on this standardized test (from
The least-squares regression line for these data has a slope of approximately
What is the value of the y-intercept of the least-squares regression line for these data? Round your answer to at least four decimal places. What is the value of the sample correlation coefficient for these data? Round your answer to at least three decimal places. |