Hi,
I'll really appreciate it if someone could help me with interpreting box plots. The web has helped, but I am still a little bit confused.

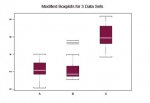
#1. Which one of the 3 distributions is most likely to have a mean that is greater than
the median? A B C I think it's C. The box plot is shifted most to the left.
#2. Which one has the smallest maximum? A B C Would the answer be A?
#3. Which one has the smallest value of Q3? A B C B?
Thank you
I'll really appreciate it if someone could help me with interpreting box plots. The web has helped, but I am still a little bit confused.
#1. Which one of the 3 distributions is most likely to have a mean that is greater than
the median? A B C I think it's C. The box plot is shifted most to the left.
#2. Which one has the smallest maximum? A B C Would the answer be A?
#3. Which one has the smallest value of Q3? A B C B?
Thank you
Attachments
Last edited:
")