michael menen
New member
- Joined
- Jan 22, 2016
- Messages
- 1
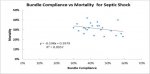
Attached are two graphs comparing death from sepsis (blood stream infection) and a treatment (bundle)
First, if you look at the aggregate data for all Facilities (17), you see a very nice negative correlation between bundle and mortality (correlation coefficient = -0.31).
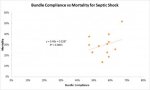
If you plot the same data relationship broken down by individual facility, there is actually a REVERSE correlation for (CORREL = + 0.29)


How is that possible?
First, if you look at the aggregate data for all Facilities (17), you see a very nice negative correlation between bundle and mortality (correlation coefficient = -0.31).
If you plot the same data relationship broken down by individual facility, there is actually a REVERSE correlation for (CORREL = + 0.29)
How is that possible?
")