Ted_Grendy
New member
- Joined
- Nov 11, 2018
- Messages
- 36
Hello all
I am trying to learn more about statistics and wanted to ask the following questions:-
1) Are the following terms mean the same thing:-
Normal Distribution= Gaussian Distribution
2) Does a Normal Distribution data set only contain random error and is free from systematic errors (assume perfect world).
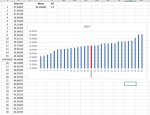
3) I am trying to plot a bell shaped curve for a Normal Distribution data set of 30 measurements with a mean of 40.1484 and a SD of 1.5.
I sort my data into low to high and add the average in the middle but the plot does not show a bell shaped curve (see attached).
How can I plot my measurements to show a bell shaped curve (I have been assured that the data set is a
Thank you.
I am trying to learn more about statistics and wanted to ask the following questions:-
1) Are the following terms mean the same thing:-
Normal Distribution= Gaussian Distribution
2) Does a Normal Distribution data set only contain random error and is free from systematic errors (assume perfect world).
3) I am trying to plot a bell shaped curve for a Normal Distribution data set of 30 measurements with a mean of 40.1484 and a SD of 1.5.
I sort my data into low to high and add the average in the middle but the plot does not show a bell shaped curve (see attached).
How can I plot my measurements to show a bell shaped curve (I have been assured that the data set is a
Thank you.