Odd shape circle = Curve?

hwall95

New member
Joined
Jul 21, 2012
Messages
4
Okay for my one of my maths assignments, i have to calculate the area of the a lake called Lake McKenzie the trapezoidal rule. We are using a map of google maps, and just using the scale as measurements. Okay the question is that, can i turn this oddly shape lake into a single curve through the gathering of its points, and use that to calculate the area? So basically I'm asking can you turn a circular shape into a curve and will it have the same area under the curve? Ive been thinking about it for a day or so now and I cant get me head around so I thought id ask. Haha so thanks to anyone that can answer this, and sorry if i put it into the wrong section, Geometry sounded similar to question I thought. Haha so thanks heaps :)
 

Attachments

  • Curve.jpg
    Curve.jpg
    87.8 KB · Views: 5
  • Maths B2.jpg
    Maths B2.jpg
    62.4 KB · Views: 5
i have to calculate the area of [Lake McKenzie using] the trapezoidal rule.

can i turn this oddly shape lake into a single curve through the gathering of its points, and use that to calculate the area?

I'd like to clarify whether this is something that you're thinking of trying after you do the assignment using the method that you've been instructed to use.
 
Okay for my one of my maths assignments, i have to calculate the area of the a lake called Lake McKenzie the trapezoidal rule. We are using a map of google maps, and just using the scale as measurements. Okay the question is that, can i turn this oddly shape lake into a single curve through the gathering of its points, and use that to calculate the area? So basically I'm asking can you turn a circular shape into a curve and will it have the same area under the curve? Ive been thinking about it for a day or so now and I cant get me head around so I thought id ask. Haha so thanks to anyone that can answer this, and sorry if i put it into the wrong section, Geometry sounded similar to question I thought. Haha so thanks heaps :)
What does "the gathering of its points mean? You can construct a curve that has the same area under it as a circle- because a circle is very simple figure- but it is not easy to determine that curve even in that simple case. How did you get that curve from the map?
 
What does "the gathering of its points mean? You can construct a curve that has the same area under it as a circle- because a circle is very simple figure- but it is not easy to determine that curve even in that simple case. How did you get that curve from the map?

I just put the shape into photoshop and used to the ruler tool to get a measurement for example if i got 400 units, and i know the scale to be 85.04 units = 500m, so i used to the scale to find the distance ((400/85.04)*500)m. So i formed the curve from measuring the distance across the lake in intervals and then placed those measurements into excel.

And to "mmm4444bot", we've only been instructed too calculate the area through the trapezoidal rule, I just had an idea that instead of breaking the shape into smaller bits then applying the rule, it would be easier to form one shape, but I wasn't exactly sure if that method was accurate.
 
i formed the curve from measuring the distance across the lake in intervals and then placed those measurements into excel.

Were all of these intervals the same width? What is the width of the intervals?
 
all the intervals had a width of 14.17 units

Did you measure across the lake along the left side of these intervals or along the right side?

Looking at the units on the horizontal axis of your graph, I'm also wondering what the scale is with respect to the units used in the interval width.
 
Did you measure across the lake along the left side of these intervals or along the right side?

Looking at the units on the horizontal axis of your graph, I'm also wondering what the scale is with respect to the units used in the interval width.

Umm the graph itself itsnt to 14.07 units but rather 1 = 14.07, as it was just a graph i made really quickly, i shouldnt affect the graph too much as it increases linearly the same way it would anyways
 
Okay -- well, I'm not familiar with the ruler tool or photoshop. I think that you are on the right track, but there are still things that I don't know (eg: number of measurements, locations of point-to-point measurements, photoshop or excel algorithms).

You previously wrote the following.

I just had an idea that instead of breaking the shape into smaller bits then applying the rule, it would be easier to form one shape, but I wasn't exactly sure if that method was accurate.

This method is accurate, if you do it correctly.

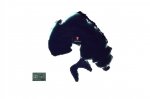
I suggest that you obtain a few printouts of the map and draw on them increasingly smaller-interval lines across the lake and "quickly" measure the left-hand lengths the way you were shown, write out the calculations, and then compare the resulting estimated areas.

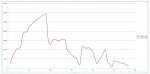
If it were humanly possible for somebody to keep narrowing those intervals until finally they were literally drawing 600 evenly-spaced lines across the printout, then their measurements plotted would graph similar to what you posted -- a smooth curve. (I did not attempt to understand either of the scales displayed on your graph.)

In other words, the finer the details, the closer the approximations. That's the beauty of the trapezoid method programmed. With narrower and narrower intervals, those tiny triangles (at the ends of the measurements) representing error have a diminishing aggregate area. The approximations using narrowing intervals approach a limit (in more ways than one), and that limit is the "exact" area of the printed lake.

Again, I don't know how many measurements you took and where, but if your hand-verified results jive with the software-assisted area from excel then you're probably on the right track. Best to understand paper-and-pencil method thoroughly first; you answer a lot of your own future questions that way.

Others may chime in, so stay 'posted'. :cool:
 
Last edited:
Top