I have a graph plotted against database size in x axis and time to get the output in y axix.
Say when I have 10MB data, i got output in 5 mints.
for 20MB, i got in 7 mint
30 MB i got in 9 mints and so on.
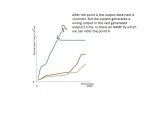
Untill it was 60MB..i was able to get correct output and in 13 mints i got it.
when the size is greater than 60MB, i am not getting correct output. The system is just showing the output generated at 60MB size and time as 13 mints. For 70, 80 , 100, 110MBs.. i am having the same issue. The output obtained is not correct. But it producing the output(wrong output) in the same 13 mints.
My question is, is der an mathematical explanation that i can give to that point. The graph is shown in figure

Say when I have 10MB data, i got output in 5 mints.
for 20MB, i got in 7 mint
30 MB i got in 9 mints and so on.
Untill it was 60MB..i was able to get correct output and in 13 mints i got it.
when the size is greater than 60MB, i am not getting correct output. The system is just showing the output generated at 60MB size and time as 13 mints. For 70, 80 , 100, 110MBs.. i am having the same issue. The output obtained is not correct. But it producing the output(wrong output) in the same 13 mints.
My question is, is der an mathematical explanation that i can give to that point. The graph is shown in figure
")