This is one of the opening questions that happen in my assignment, and if someone could quickly walk me through how or what I am supposed to do I would be greatly in your debt.
Question 2
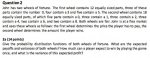
John has two wheels of fortune. The first wheel contains 12 equally-sized parts; three of these parts contain the number 0, four contain a 3, and five contain a 5. The second wheel contains 18 equally-sized parts, of which five parts contain a 0, three contain a 1, three contain a 2, three contain a 4, two contain a 6, and two contain an 8. Both wheels are fair. John is at a flea market and uses these wheels as follows: the first wheel determines the price the player has to pay, and the second wheel determines the amount the player wins.
2a (14 points)
Give the probability distribution functions of both wheels of fortune. What are the expected payoffs and variances of both wheels? How much can a player expect to win by playing the game once, and what is the variance of this expected profit?
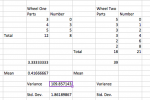
So far I have tried charting the numbers with the sections per wheel and trying to find variance, but each time I do this I find different answers using my graphical calculator, excel and manually going through it.

Here is a spreadsheet I was trying to use, thanks for any direction in advance.
Question 2
John has two wheels of fortune. The first wheel contains 12 equally-sized parts; three of these parts contain the number 0, four contain a 3, and five contain a 5. The second wheel contains 18 equally-sized parts, of which five parts contain a 0, three contain a 1, three contain a 2, three contain a 4, two contain a 6, and two contain an 8. Both wheels are fair. John is at a flea market and uses these wheels as follows: the first wheel determines the price the player has to pay, and the second wheel determines the amount the player wins.
2a (14 points)
Give the probability distribution functions of both wheels of fortune. What are the expected payoffs and variances of both wheels? How much can a player expect to win by playing the game once, and what is the variance of this expected profit?
So far I have tried charting the numbers with the sections per wheel and trying to find variance, but each time I do this I find different answers using my graphical calculator, excel and manually going through it.
Here is a spreadsheet I was trying to use, thanks for any direction in advance.
Attachments
Last edited by a moderator: