Hello everyone,
When I draw the straight line into a chart, I can easily see the slope formula in a way that makes sense:
m = ΔY/Δx
However, if we kick off from the basic equation below:
y = m x + b
When isolating M, we get the following:
m = y-b/x
The numerator represents well the ΔY, however I cannot see the change in X!
I suppose that a straight line departs or passes always from/through coordinate (0,b) where b can be any number in the Y-axis, which means the denominator would be "x-o" which equals x and the equation above despite being only X in the denominator, it already represents Δx.
But for this equation to make sense, all straight lines need to depart or pass (0,b), correct?
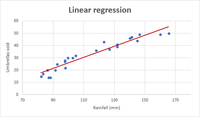
What about the cases in which the straight line does not touch the Y axis (as per attachment), how this "m = y-b/x" can be the same as this "m = ΔY/Δx"?
Thank you in advance!
When I draw the straight line into a chart, I can easily see the slope formula in a way that makes sense:
m = ΔY/Δx
However, if we kick off from the basic equation below:
y = m x + b
When isolating M, we get the following:
m = y-b/x
The numerator represents well the ΔY, however I cannot see the change in X!
I suppose that a straight line departs or passes always from/through coordinate (0,b) where b can be any number in the Y-axis, which means the denominator would be "x-o" which equals x and the equation above despite being only X in the denominator, it already represents Δx.
But for this equation to make sense, all straight lines need to depart or pass (0,b), correct?
What about the cases in which the straight line does not touch the Y axis (as per attachment), how this "m = y-b/x" can be the same as this "m = ΔY/Δx"?
Thank you in advance!