alexandra.vo
New member
- Joined
- Jan 15, 2021
- Messages
- 29

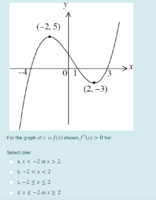
At x=-2 and x=+2, the slope of the curve (as approximated in the drawing) = 0.Ok thankyou! I'm thinking that we don't want to include -2 and 2 because the slope is decreasing at those points? So I think A?
Excellent point. I missed that one. I got a few professors upset with me for saying things like this on exams. I truly respected my professors and I felt that I had no right at all to rewrite their exam the way they meant to write it. So I just stated why the problem was not possible to solve.I would object to all the choices on the ground that there is NO "f(x)" shown on the graph so we cannot know if any of them are correct!
It does say under the diagram that the graph of f(x) is shown.I would object to all the choices on the ground that there is NO "f(x)" shown on the graph so we cannot know if any of them are correct!