Hello everyone, this is not an homework but rather a function I'm trying to build in order to get outputs from my input data, let me explain better.
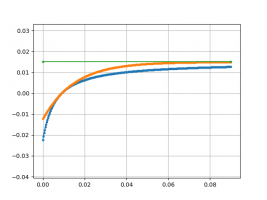
Basically I've got some input data that need to be transformed, every input is >= a certain value that I'll call x (basically this value is the x-axis intersection), then I have a maximum value that can be given as an output (which is the horizontal limit). Here on the image you may understand better:

As you can see I want to input a certain value and get an output based on the function f(x). I'm just a math rookie student in economics so please keep it simple, I just need a function that I can put into excel, such as: cell A1 contain "0.001", cell A2 transform "0.001" to the output given the function.
I know this is a logarithmic function, I know how to calculate limits and intersection GIVEN the function, not the other way around... so that's the problem.
Also, I guess there is the steepness of the function which is something that I should be able to manage too with a given input.
So summarizing:
Basically I've got some input data that need to be transformed, every input is >= a certain value that I'll call x (basically this value is the x-axis intersection), then I have a maximum value that can be given as an output (which is the horizontal limit). Here on the image you may understand better:
As you can see I want to input a certain value and get an output based on the function f(x). I'm just a math rookie student in economics so please keep it simple, I just need a function that I can put into excel, such as: cell A1 contain "0.001", cell A2 transform "0.001" to the output given the function.
I know this is a logarithmic function, I know how to calculate limits and intersection GIVEN the function, not the other way around... so that's the problem.
Also, I guess there is the steepness of the function which is something that I should be able to manage too with a given input.
So summarizing:
- The function has an horizontal limit based on the value I choose.
- The function has an x-axis intersection based on the value I choose.
- The function reach the horizontal limit based on a "speed"/"steepness"/"elasticity" I choose.
- To function return an y value when I insert an x input.