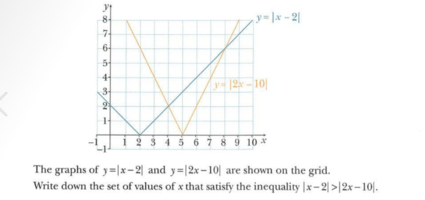
The blue graph is y=abs(x-2).
The red graph is y=abs(2x-10).
If you want to find , graphically, where abs(x-2) = abs(2x-10), you would look for the x-coordinates of the points of intersection of the blue graph and the red graph(ie x=4 or 8).
If you want to find when abs(x-2) > abs(2x-10), you need to look at where the blue graph lies above (ie >) the red graph.
Can you see, for what x-values, the blue graph lies above the red graph? It will be an interval of points, such as ?? < x < ??
Note: This is the same as what you would do for normal graphs without involving absolute values when dealing with inequalities rather than equalities (equations).