Understanding Polynomial Regression Equation

jbenfit

New member
Joined
Mar 23, 2022
Messages
2
Hi all, I'm taking a machine learning computer programming course and am in the polynomial regression section. I'm having trouble understanding the equation for polynomial regressions.
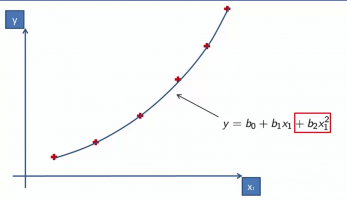
specifically: Screen Shot 2022-03-23 at 11.49.10 AM.png

I haven't dealt with this type of math since high school and was wondering if someone could help me understand what this means. Here's what I think I understand so far:

If I have a dataset of the following (let's say b0 is 40,000):

LevelSalary
145,000
250,000
360,000

Then I can find the linear regression by y = 40,000 + b1 * x1
if b1 = (50,000-45,000)/(2-1) then b1 = 5000
therefore 45000 = 40,000 + 5000 * 1

I gather that I need to add in the b2x1^2 but if I try to use a similar method to find b2 then I get confused and can't get it to work out:
45,000 = 40,000 + 5000 * 1 + b2 * 1^2
45,000-40,000 = 5000
5000 = 5000 *1 + b2 * 1
5000 - 5000 = b2 * 1
b2 =0
which makes sense because b2 and x1^2 need to cancel each other out so that y can equal 45,000...

Then inserting x and y from the second row of data to try and solve for b2 again
50,000 = 40,000 + 5000 * 2 + b2 * 2^2
50,000 - 40,000 = 10,000
10,000 = 10,000 + b2 * 4
0 = b2 *4
b2 = 0

I don't really know where to go from here to understand how the equation eventually creates a curved line that will closely fit the data points in the table. I'm sure I'm way off on something I just can't figure out what.

Thanks!
 
45,000 = 40,000 + 5000 * 1 + b2 * 1^2
This is incorrect.

Assume that your polynomial is

y = a + b*x + c*x^2 → then

45000 = a + b * 1 + c * 1^2 ................................ (1)​
50000 = a + b * 2 + c * 2^2 ................................ (2)​
60000 = a + b * 3 + c * 3^2 ................................ (3)​

You have 3 equations and 3 unknowns (a, b & c). Solve it.
I might be missing something here, but is not this a polynomial interpolation rather than a linear regression? Is it possible that the question is about linear approximations of polynomials?
 
I might be missing something here, but is not this a polynomial interpolation rather than a linear regression? Is it possible that the question is about linear approximations of polynomials?
You're correct. The equation given is not a multiple linear regression model, but a polynomial interpolation! It should be:Screen Shot 2022-03-24 at 12.48.27 AM.png
@jbenfit
Your dataset appears to only have 1 explanatory variable (Level 1,2, 3), it becomes a simple linear regression:
Screen Shot 2022-03-24 at 1.04.27 AM.png
 
Last edited:
This is incorrect.

Assume that your polynomial is

y = a + b*x + c*x^2 → then

45000 = a + b * 1 + c * 1^2 ................................ (1)

50000 = a + b * 2 + c * 2^2 ................................ (2)

60000 = a + b * 3 + c * 3^2 ................................ (3)

You have 3 equations and 3 unknowns (a, b & c). Solve it.
You're correct. The equation given is not a multiple linear regression model, but a polynomial interpolation! It should be:View attachment 31805
@jbenfit
Your dataset appears to only have 1 explanatory variable (Level 1,2, 3), it becomes a simple linear regression:
View attachment 31806
@BigBeachBanana and @blamocur. Thank you so much for replying. Sorry for my delay in response. The levels and salaries in the table in my original post were from the example in the course however I should have included all of the observations because that might have cleared things up sooner. They said that a "Polynomial Linear Regression" was needed over a Simple Linear Regression because the data rises exponentially (the levels represent an entry level employee all the way up to the CEO where the entry level makes 45k per year and the CEO over a million). When plotting the observations on a graph it looks like the screenshot below. With this in mind could you clarify which equation is correct as well as how I would change my original attempt at solving it to get the right answer?

Thanks!
Justin
 

Attachments

  • Screen Shot 2022-04-01 at 10.05.48 AM.png
    Screen Shot 2022-04-01 at 10.05.48 AM.png
    157.6 KB · Views: 2
This is incorrect.

Assume that your polynomial is

y = a + b*x + c*x^2 → then

45000 = a + b * 1 + c * 1^2 ................................ (1)

50000 = a + b * 2 + c * 2^2 ................................ (2)

60000 = a + b * 3 + c * 3^2 ................................ (3)

You have 3 equations and 3 unknowns (a, b & c). Solve it.

@BigBeachBanana and @blamocur. Thank you so much for replying. Sorry for my delay in response. The levels and salaries in the table in my original post were from the example in the course however I should have included all of the observations because that might have cleared things up sooner. They said that a "Polynomial Linear Regression" was needed over a Simple Linear Regression because the data rises exponentially (the levels represent an entry level employee all the way up to the CEO where the entry level makes 45k per year and the CEO over a million). When plotting the observations on a graph it looks like the screenshot below. With this in mind could you clarify which equation is correct as well as how I would change my original attempt at solving it to get the right answer?

Thanks!
Justin
I've made the mistake of not reading the subscript carefully. You're correct that the data should be modelled using the Polynomial Regression model in the OP. However, regression models are more suitable for numerical variables, and not categorical variables (like levels 1,2, 3), thus there are extra necessary steps required. I think this link would be helpful to you.
 
Last edited:
I hate to add confusion, but you CAN use linear regression techniques to find a CURVE of best fit.

So let's say that we have one dependent variable and one independent variable of interest. We fit a linear model to the data, and we notice anamolies through analyzing the error terms. When we graph the data, it appears that a non-linear model would work better. One option is to try a polynomial model. To maximize the degrees of freedom, we want to try polynomials of low degree. Let's start with a quadratic. Then we calculate the squares of the independent variable and treat the values of the independent variable and the squares of the independent variables as two distinct variables and analyze them using linear techniques.

Now I must admit that it literally has been decades since I did that kind of work, and all I remember is that analyzing the goodness of fit raises a number of subtleties (degrees of freedom, heteroskedacity, etc.) When I had to get that sort of analysis done on anything material, I would hire a professional statistician. If I did it myself, I would haul out a statistics text and do a lot of review. But the mechanics of doing the work use the tools of multiple linear regression.
 
Top