You are using an out of date browser. It may not display this or other websites correctly.
You should upgrade or use an alternative browser.
You should upgrade or use an alternative browser.
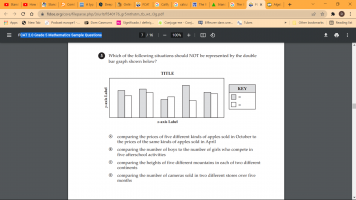
which of the following situations should not be represented by the double bar graph...
- Thread starter eddy2017
- Start date

BigBeachBanana
Senior Member
- Joined
- Nov 19, 2021
- Messages
- 2,181
For each scenario, determine the x-axis label, y-axis label, grey bar key, and white bar key.what is it with this exercise?. I don't get it, any hints?.
thanks in advance,
eddy
View attachment 31382
For example D,
x-axis label = months
y-axis label = number of cameras sold
grey bar key = store 1
white bar key = store 2
Which scenario(s) doesn't make sense?
Last edited:
eddy2017
Elite Member
- Joined
- Oct 27, 2017
- Messages
- 2,525
Thanks a lot. I'll report back tomorrow. Have a good night everyone. It's been a good math day!.For each scenario, determine the x-axis label, y-axis label, grey bar key, and white bar key.
For example D,
x-axis label = months
y-axis label = number of cameras sold
grey bar key = store 1
white bar key = store 2
Which scenario(s) doesn't make sense?
eddy2017
Elite Member
- Joined
- Oct 27, 2017
- Messages
- 2,525
Scenario A does not make any sense.For each scenario, determine the x-axis label, y-axis label, grey bar key, and white bar key.
For example D,
x-axis label = months
y-axis label = number of cameras sold
grey bar key = store 1
white bar key = store 2
Which scenario(s) doesn't make sense?
D
Deleted member 4993
Guest
How would you fit scenario C to the graph shown ? What would be x-axis label? How about y-axis ? How would you assign keys ?Scenario A does not make any sense.
eddy2017
Elite Member
- Joined
- Oct 27, 2017
- Messages
- 2,525
there is no legend on the graph bar that is why is a little difficult to read and that is where the trick is.How would you fit scenario C to the graph shown ? What would be x-axis label? How about y-axis ? How would you assign keys ?
As regards to your question I would say that the height would be on the y-axis and the continents on the x-axis. That is how I can imagine comparing the height of the mountains.
BigBeachBanana
Senior Member
- Joined
- Nov 19, 2021
- Messages
- 2,181
I think A is possible to represent with the double bar graph.Scenario A does not make any sense.
Dr.Peterson
Elite Member
- Joined
- Nov 12, 2017
- Messages
- 16,089
I don't think you understand how double bar graphs are used; the y-axis would never be heights of mountains.there is no legend on the graph bar that is why is a little difficult to read and that is where the trick is.
As regards to your question I would say that the height would be on the y-axis and the continents on the x-axis. That is how I can imagine comparing the height of the mountains.
Can you show us an example you were given of a double bar graph, so you can compare the data it shows with these examples?
If you haven't learned about them at all, here is one explanation.
I recommend trying to actually draw a graph for each case (starting with A), using pretend data. (Or just label their graph.) Then we can see where you are thinking wrongly.
eddy2017
Elite Member
- Joined
- Oct 27, 2017
- Messages
- 2,525
Can you show us an example you were given of a double bar graph, so you can compare the data it shows with these examples?

eddy2017
Elite Member
- Joined
- Oct 27, 2017
- Messages
- 2,525
the thing here lies in finding out what to label the axis with. that is it. it is not easyI think A is possible to represent with the double bar graph.
D
Deleted member 4993
Guest
Please read the statement 3 again carefully. How many continents does it talk about? How come on x-axis there are 5 groups?there is no legend on the graph bar that is why is a little difficult to read and that is where the trick is.
As regards to your question I would say that the height would be on the y-axis and the continents on the x-axis. That is how I can imagine comparing the height of the mountains.
eddy2017
Elite Member
- Joined
- Oct 27, 2017
- Messages
- 2,525
Yes, I notice that. there are 7 continents so the double bars are not enough for 7. this one does not represent the situation stated.Please read the statement 3 again carefully. How many continents does it talk about? How come on x-axis there are 5 groups?
Last edited:
D
Deleted member 4993
Guest
Please re-WRITE the condition #3 here.Yes, I notice that. there are 7 continents so the double bars are not enough for 7. this one does not represent the situation stated.
Dr.Peterson
Elite Member
- Joined
- Nov 12, 2017
- Messages
- 16,089
No, it isn't easy if you haven't done it before. All you can do is try. Once you've actually done it (right or wrong), you are starting to learn.the thing here lies in finding out what to label the axis with. that is it. it is not easy
Here is what I am asking you to do, for case A:

I've called the five kinds of apple A, B, C, D, and E, rather than be creative! For each kind, there are two bars, representing the prices in October and in April. I left out the title, but that really isn't important, as it would just summarize what they've told you.
Do that for each case, and then see if it makes sense. One of them will not. You won't see that until you've tried.
Last edited:
eddy2017
Elite Member
- Joined
- Oct 27, 2017
- Messages
- 2,525
tried to do my best with pencil and paper. if there is one missing let me knowNo, it isn't easy if you haven't done it before. All you can do is try. Once you've actually done it (right or wrong), you are starting to learn.
Here is what I am asking you to do, for case A:
View attachment 31396
I've called the five kinds of apple A, B, C, D, and E, rather than be creative! For each kind, there are two bars, representing the prices in October and in April. I left out the title, but that really isn't important, as it would just summarize what they've told you.
Do that for each case, and then see if it makes sense. One of them will not. You won't see that until you've tried.
Attachments
Dr.Peterson
Elite Member
- Joined
- Nov 12, 2017
- Messages
- 16,089
Thanks. Here they are:
B:

The vertical axis is not "school activities"; it has to be a number. What number is it? (Do you see this in your example in #9?)
The horizontal axis is not "boys and girls"; the label there has to be about something with give categories.
And where will the names of the five activities be put? (Do you see how each pair of bars has a label in #9?)
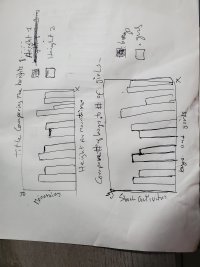
C:

The vertical axis is not "mountains"; again, it has to be a number. And what are "height 1" and "height 2"? Where do the names of the five mountains go? (Or is it ten?) Where are the names of the continents?
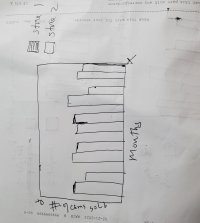
D:

This one is correct, except that the months need to be named.
And this one makes sense, doesn't it? For each month, we have two bars, telling us how many cameras were sold in each of the two stores, and we can use that to see which store did better in each month.
This last bit, by the way, is what you need in order to answer their question: Does the graph tell you anything meaningful? Does it help in comparing something? Do the pairs of bars belong together?
B:
The vertical axis is not "school activities"; it has to be a number. What number is it? (Do you see this in your example in #9?)
The horizontal axis is not "boys and girls"; the label there has to be about something with give categories.
And where will the names of the five activities be put? (Do you see how each pair of bars has a label in #9?)
C:
The vertical axis is not "mountains"; again, it has to be a number. And what are "height 1" and "height 2"? Where do the names of the five mountains go? (Or is it ten?) Where are the names of the continents?
D:
This one is correct, except that the months need to be named.
And this one makes sense, doesn't it? For each month, we have two bars, telling us how many cameras were sold in each of the two stores, and we can use that to see which store did better in each month.
This last bit, by the way, is what you need in order to answer their question: Does the graph tell you anything meaningful? Does it help in comparing something? Do the pairs of bars belong together?
eddy2017
Elite Member
- Joined
- Oct 27, 2017
- Messages
- 2,525
The vertical axis is not "school activities"; it has to be a number. What number is it? (Do you see this in your example in #9?)Thanks. Here they are:
B:
View attachment 31403
The vertical axis is not "school activities"; it has to be a number. What number is it? (Do you see this in your example in #9?)
The horizontal axis is not "boys and girls"; the label there has to be about something with give categories.
And where will the names of the five activities be put? (Do you see how each pair of bars has a label in #9?)
C:
View attachment 31402
The vertical axis is not "mountains"; again, it has to be a number. And what are "height 1" and "height 2"? Where do the names of the five mountains go? (Or is it ten?) Where are the names of the continents?
D:
View attachment 31401
This one is correct, except that the months need to be named.
And this one makes sense, doesn't it? For each month, we have two bars, telling us how many cameras were sold in each of the two stores, and we can use that to see which store did better in each month.
This last bit, by the way, is what you need in order to answer their question: Does the graph tell you anything meaningful? Does it help in comparing something? Do the pairs of bars belong together?
# 5
the x axis >the 5 categories>
- Poster Making.
- Photography.
- Debate.
- Spelling Bee.
- Essay Writing.
Dr.Peterson
Elite Member
- Joined
- Nov 12, 2017
- Messages
- 16,089
In my example for (A), I suggested not trying to be creative about the categories. This is not what I asked for! Or at any rate, this list is the least important thing you could state.The vertical axis is not "school activities"; it has to be a number. What number is it? (Do you see this in your example in #9?)
# 5
the x axis >the 5 categories>
- Poster Making.
- Photography.
- Debate.
- Spelling Bee.
- Essay Writing.
Yes, the horizontal (x) axis will have the five pairs of bars labeled with five activities such as these; and the overall label at the bottom would say something like "school activities".
But my main question about (B) was, what will the vertical (y) axis represent?