eddy2017
Elite Member
- Joined
- Oct 27, 2017
- Messages
- 2,525
Graph B is not meaningful. There is no way I think we can compare the five categories in the x axisThanks. Here they are:
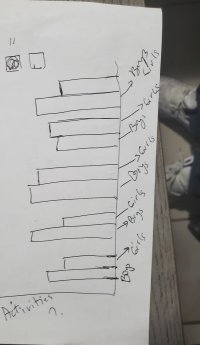
B:
View attachment 31403
The vertical axis is not "school activities"; it has to be a number. What number is it? (Do you see this in your example in #9?)
The horizontal axis is not "boys and girls"; the label there has to be about something with give categories.
And where will the names of the five activities be put? (Do you see how each pair of bars has a label in #9?)
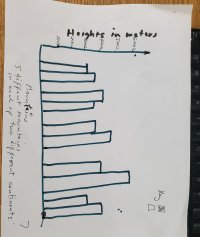
C:
View attachment 31402
The vertical axis is not "mountains"; again, it has to be a number. And what are "height 1" and "height 2"? Where do the names of the five mountains go? (Or is it ten?) Where are the names of the continents?
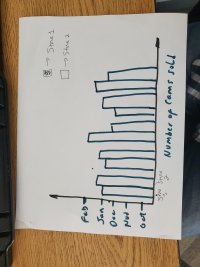
D:
View attachment 31401
This last bit, by the way, is what you need in order to answer their question: Does the graph tell you anything meaningful? Does it help in comparing something? Do the pairs of bars belong together?
with boys and girsl on the vertical (y axis).