Hi Guys,
I'm not trained in mathematics, but I need to explain the following in such terms. Could you please assist?
The table below summarises each value's parameters:
If we plot the values graphically we have the following:

What is already obvious is that we have a curve that is progressively flattening. Now if we extend the number of values to say 12, the progressive flattening of the curve is clearer.

So here is my question: What is the nature of this function? I think it may be something like an inverse natural log (or whatever - I don't know).
I need to explain this in words so that if we didn't have the benefit of the images, that a mathematician would immediately understand what I am referring to.
Thank you maths gurus!
Gareth
I'm not trained in mathematics, but I need to explain the following in such terms. Could you please assist?
- Three values are ranked ordinally (1 to 3) in terms of importance.
- Therefore: Value 1 > Value 2 > Value 3
- Each value carries the same weight. The sum of weights = 1. Therefore the individual weight is 1/3=0.33
- The ordinal importance is inversely proportional to the value's rank and is calculated as such: 1/(value weight*value rank) e.g. for value 1 which is the most important, the ordinal importance is: 1/(0.33*1)=3
- The sum of the ordinal importance values allows the relative importance (or the influence probability) to be calculated, which is essentially a percentage value. E.g. Value 1 influence probability is calculated: 3/(3+1.5+1)*100=54.5%
The table below summarises each value's parameters:
| Value | Ordinal importance | Influence Probability |
| 1 | 3 | 54.5 |
| 2 | 1.5 | 27.3 |
| 3 | 1 | 18.2 |
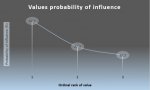
If we plot the values graphically we have the following:
What is already obvious is that we have a curve that is progressively flattening. Now if we extend the number of values to say 12, the progressive flattening of the curve is clearer.
So here is my question: What is the nature of this function? I think it may be something like an inverse natural log (or whatever - I don't know).
I need to explain this in words so that if we didn't have the benefit of the images, that a mathematician would immediately understand what I am referring to.
Thank you maths gurus!
Gareth