Drawing Normal Curve for height distribution

RicanGurl

Junior Member
Joined
Sep 30, 2007
Messages
56
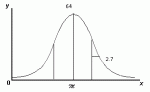
The distribution of heights of women aged 20 to 29 is approximately Normal with mean 64 inches and standard deviation 2.7 inches. Draw a normal curve on which this mean nd standard deviation are correctly located.

Click attachment to see my work, and please help correct this.
 

Attachments

  • CurveImadeforproblem.GIF
    CurveImadeforproblem.GIF
    2.4 KB · Views: 365
RicanGurl said:
i need help!
And you're apparently needing immediate help, which of course is not possible for a free service "staffed" with volunteers who surf by when they can, and who usually sleep at night. :wink:

To get the immediate on-demand responses you need, you'll almost certainly need to subscribe to a paid service. Make sure you check their hours before signing up; not all paid services have paid employees online at all times.

Good luck! :D

Eliz.
 
The standard deviation is the distance from the mean to the inflection points on each side. The vertical lines need to be the same length on either side of the mean. What does your little horizontal line represent?
 
Top