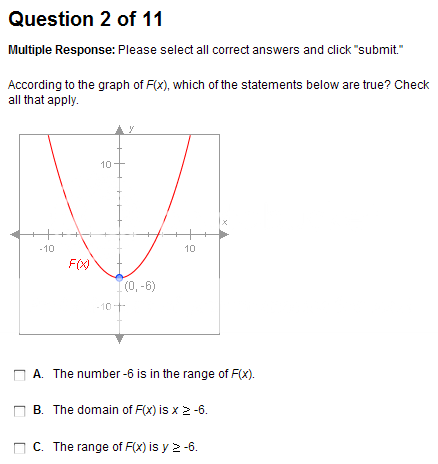
I'm having such a hard time with this problem. I don't really understand the graph.I understood it when I did it using the chart but the graph is just complicated to me.
This site uses cookies to help personalise content, tailor your experience and to keep you logged in if you register.
By continuing to use this site, you are consenting to our use of cookies.