I have a table with the following: fatal accidents: Frequency: 0 1 1 3 2 6 3 4 4...
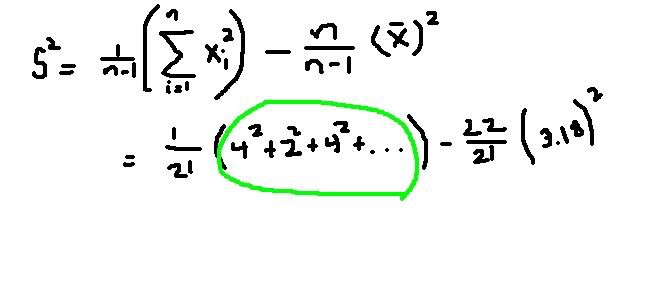
J Jeonsah New member Joined Feb 5, 2012 Messages 14 Mar 6, 2012 #1 I have a table with the following: fatal accidents: Frequency: 0 1 1 3 2 6 3 4 4 5 5 0 6 2 7 0 8 0 9 0 10 0 11 1 The professor has: I am lost on how he got the part in green? Can someone help me out? Thanks
I have a table with the following: fatal accidents: Frequency: 0 1 1 3 2 6 3 4 4 5 5 0 6 2 7 0 8 0 9 0 10 0 11 1 The professor has: I am lost on how he got the part in green? Can someone help me out? Thanks