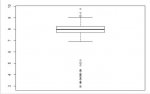
Please look at the attachment for the boxplot.
My thought process for this question is that if we ignore outliers, the data looks perfectly symmetrical because there is approximately the same distance between Q1 to Q2 (the median) and Q2 to Q3. The distance between the maximum (ignoring outliers) and median is also approximately the same as the distance between the minimum and median, all characteristics of a symmetrical distribution.
However, if we take outliers into account, the data is skewed to the left because there are more low outliers than high outliers and by roughly drawing a histogram using the boxplot, the histogram would be skewed to the left.
So my question is, when analyzing whether the shape is skewed to the right or left, do we look at outliers? And is there a general rule as to when to discard outliers?
Attachments
Last edited: