KarlieWarliee
New member
- Joined
- Feb 2, 2016
- Messages
- 9
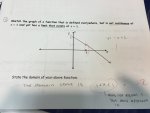
How do you sketch a graph that is not continuous at x=1 and yet has a limit that exists at x=1?
This was on a test and I'm doing corrections, what did I do wrong?

Assuming the image is your work, what you have is (what appears to be) a continuous graph and the problem states "How do you sketch a graph that is not continuous at x=1 and yet has a limit that exists at x=1?" This appears to be one of those sneaky problems where, although there are limits at x=1, the left and right hand limits are not the same.How do you sketch a graph that is not continuous at x=1 and yet has a limit that exists at x=1?
This was on a test and I'm doing corrections, what did I do wrong?
Your graph is correct. But your description of the function is completely wrong.How do you sketch a graph that is not continuous at x=1 and yet has a limit that exists at x=1?
This was on a test and I'm doing corrections, what did I do wrong?
Come to think of it, I have seen the circle [as shown at (1,1)] to represent a 'repairable' non-continuous function where left and right limits are the same.Your graph is correct. But your description of the function is completely wrong.
\(\displaystyle f(x)=\begin{cases}0 & x=1\\-x+2 &x\ne 1\end{cases}\), domain all real numbers.
The function was supposed to be defined for all x, so eliminating the value x = 1 from the domain violated that part. Otherwise, your function would have been fine. You just needed to add a different y-value for when x = 1.How do you sketch a graph that is not continuous at x=1 and yet has a limit that exists at x=1?
This was on a test and I'm doing corrections, what did I do wrong?
Code:graph: ^ y | \ | 2 | \ y = -x + 2 | \ | *\ | \ -----*----1----2---> x | \
...defined for all x EXCEPT x = 1.
")