Hi everyone.
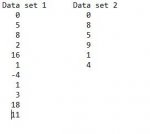
I have two data set as bellow. Data set 1 have 11 values and data set 2 have 6 values. I want to bring those both data in to same values. I meant I want to bring both data sets last number to 20 and also there should be 20 values. Is my explanation clear. What is the method to do it. Please someone help me to do it. is there any mathematical Logic to do it. what is the method to do it. I don't want to know a equation to do it if there is. I want to know the logic. Please someone help me. Thank you.

I have two data set as bellow. Data set 1 have 11 values and data set 2 have 6 values. I want to bring those both data in to same values. I meant I want to bring both data sets last number to 20 and also there should be 20 values. Is my explanation clear. What is the method to do it. Please someone help me to do it. is there any mathematical Logic to do it. what is the method to do it. I don't want to know a equation to do it if there is. I want to know the logic. Please someone help me. Thank you.
Attachments
Last edited:
") This is Math Forum. We don't need an English teacher here.
This is Math Forum. We don't need an English teacher here.