a. Estimate x for which f'(x)=0 ,
b. Find all points for which f'(x) does not exist.
c. Estimate f'(x) at the points where it is greatest or least.
d. Estimate f'(x) for x=-3,-2,-1,0,1,2,3
e. Sketch the graph of f'(x)
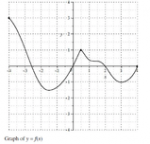
Graph of f(x):

My thoughts:
a. x=-2,3. When the tangent line is a horizontal line. So, thats when x=-2 and 3.
b. were the x values don't exist but i don't know how to get them by using f(x) graph
If you can graph f'(x), i can mostly solve all of it.
Thanks ...
b. Find all points for which f'(x) does not exist.
c. Estimate f'(x) at the points where it is greatest or least.
d. Estimate f'(x) for x=-3,-2,-1,0,1,2,3
e. Sketch the graph of f'(x)
Graph of f(x):
My thoughts:
a. x=-2,3. When the tangent line is a horizontal line. So, thats when x=-2 and 3.
b. were the x values don't exist but i don't know how to get them by using f(x) graph
If you can graph f'(x), i can mostly solve all of it.
Thanks ...
")