Using the chart that I've uploaded, the question begins:
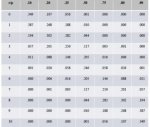
75% of teenagers and adults in the US were deficient in Vit. D. If a total of 10 American teenagers and adults were chosen at random, use the chart to figure:
1.)The probability that exactly 4 were deficient in Vit. D = I got 0.016 looking under the 0.75 column
2.) The probability that more than 8 were deficient in Vit.D = I got 0.244 if I added the 9 and 10 values on the 0.75 column
3.) The probability that 6 or more were not deficient in Vit.D= I thought to add up the values for 6 or more which was 0.922 and subtracted by 1 because the question stated "were not" and got 0.0078
Is my thinking correct?
Best,