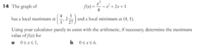
Sketch the graph, showing the turning points provided. Then consider the interval [0, 5], and keep in mind that the absolute max and min in a finite interval can be either at a turning point or at an end point of the interval. Compare the y-coordinates of the points given, and those at x=0 and x=5.
This site uses cookies to help personalise content, tailor your experience and to keep you logged in if you register.
By continuing to use this site, you are consenting to our use of cookies.
") ,
,