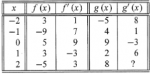
Given the following table,

(and assuming f(x) and g(x) are continuous and differentiable on the closed interval [-2, 2]),
I need to find
1. if f(x) or g(x) have any horizontal tangent lines, and
2. if f(x) or g(x) have any local maximums or minimums.
I've never completed a problem like this without having a formula. Do I need to necessarily extract some sort of formula from the table in order to solve the problem? From that point this would be easy and straightforward for me. Thanks!