Frequency Distribution charts

shaylee112

New member
Joined
Nov 1, 2005
Messages
22
#boards Frequency Standard Deviation

6 2 2.828427125
7 6 0.707106781
8 7 0.707106781
9 8 0.707106781
10 9 0.707106781
11 3 5.656854249
12 2 7.071067812
13 1 8.485281374

How do I get the Total SD???
Hope this come out o.k. I am not sure how to put it in a chart format to make it look better. Please help me figure out the total SD
 
Code:
#boards		Frequency       Standard Deviation  
                                                                            				
6                  2              2.828427125				
7                  6              0.707106781				
8                  7              0.707106781				
9                  8              0.707106781				
10                 9              0.707106781				
11                 3              5.656854249				
12                 2              7.071067812				
13                 1              8.485281374

It doesn't make sense to have a standard deviation for each value. What are you doing?
 
the directions were to prepare a frequency distribution chart
Does this approximate a normal curve?
what is the Standard Deviation (I was told to use excel)
what is the approximate probability that at lease 7 rejected boards will be producted next week?


I was given this to start

# of boards rejected in a week / frequency
6/ 2
7/ 6
8 / 7

you have to complete the rest of the table yourself to answer the assignment questions.


does this make sense now?
 
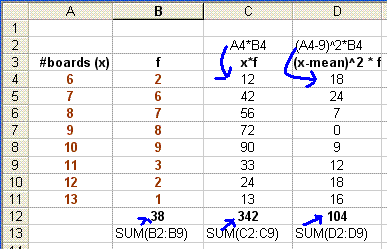
I'm not sure what your frequency distribution chart looks like, but in Excel I make a table with columns: #boards (x), frequency (f), xf, (x - xbar)^2 * f and use

\(\displaystyle \mbox{ xbar = \frac{\sum (xf)}{\sum f}}\) and \(\displaystyle \mbox{ SD = \sqrt{\frac{\sum \left((x - xbar)^2f\right)}{\sum f}}}\)

The data doesn't look particularly normal; perhaps we're missing something.
 
looks like a formula that I don't understand how to use

how can I show you what my chart looks like? [/img]
 
You can type it in code tags. NB: don't use the tab key for spacing.
 
this is what I got for any answer but not sure how i got it and how to explain it if my teacher asks. can you help ?

Total SD= 3.649200826 is there a formula I can type into excel to get that answer with the chart that is on here? [/code]
 
hmm I get an SD of 1.68.

I couldn't find how to get a standard deviation from a frequency table. Here's what I did:

shaylee1.gif


The 9 is the mean: 342/38 = 9.

And then used the formula I posted above for the SD (except the denominator should be sum of f - 1 since it's from a sample).
 
Top