function graph >.<
- Thread starter ddaiwanna
- Start date
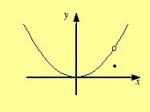
First plot y = x^2ddaiwanna said:how do you find the domain and range of {y = x^2 if x does not = 2 and 7 if x = 2}
and how do you graph it?
heLp i desperateLy need your heLp >.<
ddaiwanna said:… how do you graph it?