Task "Detect function break points , and its type, draw function graph."
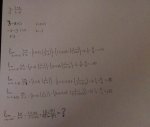
y=3−x1+x
I have done something but i don't know if it's right?
You have found the zeroes of the numerator and the denominator, but do you know what these mean? Think back to algebra, when you were graphing rational functions. (Refresh
here.) What was the point of the zeroes of the numerator? What was the (very different) point of the zeroes of the denominator?
What do you mean by "the limit as x tends toward 3 + 0"? What do you mean by "the limit as x tends toward 3 - 0"? How are these different? What are you doing with the other "limits" (which don't need to be done via limits, since the function is defined at x = -1, so you can simply evaluate)? What are you trying to accomplish? Did your book (or instructor) ever do limits of this "style"?
then i don't understand what to do with (lim->-infinity) las part.
Use the limit rules, formulas, methods, and tricks they taught you. For instance, you could divide through, top and bottom, by x; then take the limit, noting that 1/x goes to zero as x gets arbitrarily large. Or you could do the long division to convert the current polynomial "fraction" to the equivalent polynomial "mixed-number" form...
. . . . .3−x1+x=−1+3−x4
...and then apply limits to that expression.
And how to draw function.
Do the same graphing that you learned back in algebra: Find the zeroes (that is, the x-intercepts); find the vertical asymptotes (that is, the zeroes of the denominator); find the horizontal asymptotes (using
the rules you learned back then); plot some points; and then flesh in the graph.
")