Graph the line

AAA

Junior Member
Joined
Nov 29, 2020
Messages
63
Is there an easy way to graph an equation like this (Y=3/4s-1) instead of having to choose random numbers and evaluating them, because sometimes the numbers come out big and the graph they gave me has numbers until 10 only.
 

Attachments

  • Math equation.png
    Math equation.png
    25.2 KB · Views: 1
c is the y intercept. but I don't know the others
 
Yes c is the y-intercept. And m is the gradient.
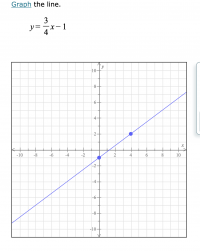
The first thing you can do is plot the y-intercept of -1 on your graph.
Then from that point, interpret the gradient of 3/4 as rise/run. So, from the point (0,-1) where do you get to if you run 4 units (in the pos x direction) and then rise 3 units (in the pos y direction). What point do you end up at?
 
Last edited:
Hi! Sorry for mot responding earlier is my answer correct
 

Attachments

  • Thank you.png
    Thank you.png
    146 KB · Views: 2
Yes very good. I'd add arrows at each end of your line to indicate it keeps on going indefinitely.

So the method to graph lines in the form = = mx + c is:
  • plot the y-intercept
  • interpret the gradient as rise/run (note: eg m = 3 = 3/1 and if it's negative then it will be a fall rather than a rise)
 
  • Like
Reactions: AAA
One question pls. How do I now when its rise and when its run?
 
What Skeeter said! That's the definition of gradient (slope). Rise is the numerator (on the top).
 
How do I [know] when [it's] rise and when [it's] run?
The change in x is called the 'run', and the change in y is called the 'rise'.

The ratio (change in y)/(change in x) is called the slope (it's a measure of the line's "steepness").

Are you taking a math class, AAA?

[imath]\;[/imath]
 

thank you mmm4444bot! Yeah I'm taking Intermediate Algebra and in Geometry in the same time ?​

 
Top