VeronicaKJ
New member
- Joined
- Mar 19, 2021
- Messages
- 1
Hi all,
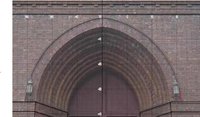
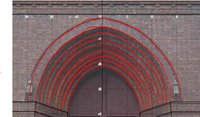
I am attempting to graph an image on Desmos, however I can not figure out the equation of these similar lines (shown in red). I've drawn over them roughly to show which lines I need to graph, and also attached a copy of the image with no lines.
Any help in figuring out the equations for these lines would be very much appreciated. I am hoping to be able to graph either to the left or the right of the y-axis, and restrict the domain and range, then move copy and paste the equation but move it down and place new restrictions, and repeat for the opposite side of the y-axis, but I'm unsure as to whether this will actually work.
Thank you in advance