rakrak1998
New member
- Joined
- Dec 5, 2015
- Messages
- 11
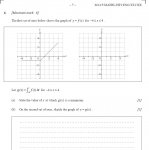
I attached the problem as an image. I understand a, the answer is x=1 because it has the most negative space under the curve.
The way i approached b was through separating the function into 2 functions. i separated it like so,
y=-1 from [-4,0]
and
y=x-1 from (0,4)
I then found the indefinite integral for both sides, but i am not sure which point MUST be on the second graph.
Any assistance is appreciated.
The way i approached b was through separating the function into 2 functions. i separated it like so,
y=-1 from [-4,0]
and
y=x-1 from (0,4)
I then found the indefinite integral for both sides, but i am not sure which point MUST be on the second graph.
Any assistance is appreciated.
")