seismicfish
New member
- Joined
- Oct 28, 2021
- Messages
- 1
Ok, so I have a large data set that has particle size distributions (surface area for each particle in the sample) for over 100 samples and I need a way to quantitatively (or semi-quantitatively) compare them to the whole data set or sort into groups with similar distribution characteristics. The vast majority of the points are in the very small size fraction but due to the very small size do not contribute proportionally all that much to the total area.
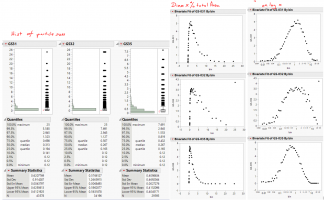
I have attached sample plots of three representative samples with visually different distributions.
-Histograms of the raw data where the y axis is the particle size
-xy plots of the particle size (bin=x axis) vs the percentage that size bin contributes to the total area (y axis). Two versions are shown, linear and log x axes (obviously log normal distributions here).
Eventually, these need to be visually comparable to one another (classes?) when the samples are plotted in real space relative to their collection point to delineate spatial patterns (purely visual). I have been banging my head on this matter for weeks. If anyone could help me I would be greatly obliged!
Thank you!