Intriguing implicit function

apple2357

Full Member
Joined
Mar 9, 2018
Messages
520
I have been playing with x^3+ k xy +y^3 =1 for different values of k using a graph plotter.
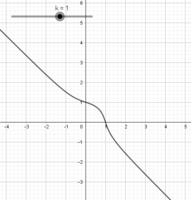
So for k=1, i get this:


1598538645223.png
Interestingly when k=3, i get something which looks like a straight line!


1598538665489.png


Infact, i differentiated it and got dy/dx = -(x^2+y)/(x+y^2)
At (1,0) and (2,-1) it gives the same gradient of -1 so the equation is x+y=1.

1. So is it a line everywhere or just locally? - Thats my first question.

And then something weird starts to happen just as i go above k=3,

1598538711537.png


So thinking about the gradient at (-1,-1) for k=3, i get dy/dx=0/0, so is there something there at that point or not? Beyond k=3 i get something near (-1,-1) as above but where is it on k=3?
This is where i am stuck!
 

Attachments

  • 1598538113871.png
    1598538113871.png
    29.5 KB · Views: 2
This is interesting. If you substitute y=1-x into x^3 + 3*x*y + y^3 then you obtain

[math] x^3+3x \left(1-x\right)+\left(1-x\right)^3[/math]
[math]=x^3+3x \left(1-x\right)-x^3+3x^2-3x+1[/math]
[math]=1[/math]
Therefore it appears that this implicit function is exactly a line when k=3
 
But can it be just a line? What about what happens at (-1,-1) where is the gradient is undefined?
 
But can it be just a line? What about what happens at (-1,-1) where is the gradient is undefined?

I think it's undefined because you're calculating the gradient at a point that doesn't actually lie on the line. You could try putting y=1-x into your gradient -(x^2+y)/(x+y^2) which will force it to only give solutions on the line. I'll bet that the denominator can never take the value zero, and that the numerator will be the negative of the denominator which will give a gradient of -1.

But I might be wrong about this, I didn't go very deep into implicit equations during my studies! Please write back with your findings if you try the above.

EDIT: I just put (-1,-1) into the LHS of the original curve x^3+ k*x*y +y^3 when k=3 and you obtain 1 which is the RHS, therefore there's a single point off to the side of the line! Interesting. This must be a starting point for the ellipse-like-shape that shows up in the 3rd quadrant for values of k>3
 
Last edited:
Thanks, that sort of makes sense to me : So the implicit function x^3+3xy+y^3=1 is a line x+y=1 and an isolated point at (-1,-1).
But when sketching the function, it doesn't mark the isolated point so just looks like a straight line!
Is there any way we would know that x^3+3xy+y^3=1 will draw the line x+y=1 without making use of a graph plotter?
 
If you consider k to be the z coordinate of a two variables function z=f(x,y), then your graphs are the contour plot of this function at different values of z (equivalent to different values of k, since z=k). Here are three plots:

a- The function graph:

F67788C8-6E54-4B7F-BF63-D072B11342B3.png

b- Intersection with plane z=1 (equivalent to k=1):

69CF7238-E7FF-487F-999A-6C2699B360BF.png

c- Intersection with plane z=3.4 (equivalent to k=3.4). Here you can see that the spot at left of the line is not a point, but a kind of "ellipse", It is a point at k=3 (z=3, where the plane z=3 will touch the "inverted paraboloid" of the left at its lower point) and it does not exist at k<3 (z<3):

01A5344D-DB0E-47B1-B86B-C42D89723C40.png

I have used Geogebra to plot the function. There you can play arround with it to better see it.
 
Last edited:
If you consider k to be the z coordinate of a two variables function z=f(x,y), then your graphs are the contour plot of this function at different values of z (equivalent to different values of k, since z=k). Here are three plots:

a- The function graph:

View attachment 21258

b- Intersection with plane z=1 (equivalent to k=1):

View attachment 21259

c- Intersection with plane z=3.4 (equivalent to k=3.4). Here you can see that the spot at left of the line is not a point, but a kind of "ellipse", It is a point at k=3 (z=3, where the plane z=3 will touch the "inverted paraboloid" of the left at its lower point) and it does not exist at k<3 (z<3):

View attachment 21260

I have used Geogebra to plot the function. There you can play arround with it to better see it.
Very interesting analysis - I did not think of that!
 
Do these contour plots help see why z=3 draws a line? The plane z=3 just touches the ellipse which is nice to see?
 
I've been trying to find a way to explain this by factoring. Here is the best I can do so far:

[MATH]x^3+3xy+y^3-1=0[/MATH] factors as [MATH](x+y-1)(x^2-xy+y^2+x+y+1)=0[/MATH]. The first factor explains the line; the second factor, if you solve it for y (using the quadratic formula) has discriminant [MATH]-3(x+1)^2[/MATH], so that the only real solution will be when [MATH]x=-1[/MATH]. This accounts for the isolated point.
 
Do these contour plots help see why z=3 draws a line? The plane z=3 just touches the ellipse which is nice to see?

The line at k=3 is a line "locally", since there is also a point at (-1,-1) (or a point at (-1,-1,3) in the 3D representation). Out of this value of k, the line begins to bend, to one side for k>3 and the opposite side for k<3 (it is no longer a straight line for k not equal 3). The 3D graph give you a general idea of what is going on. You could, of course, try to analize this 2 variables function with multivariable calculus techniques to get a more analityc info.
 
Last edited:
I've been trying to find a way to explain this by factoring. Here is the best I can do so far:

[MATH]x^3+3xy+y^3-1=0[/MATH] factors as [MATH](x+y-1)(x^2-xy+y^2+x+y+1)=0[/MATH]. The first factor explains the line; the second factor, if you solve it for y (using the quadratic formula) has discriminant [MATH]-3(x+1)^2[/MATH], so that the only real solution will be when [MATH]x=-1[/MATH]. This accounts for the isolated point.

That cuts through it quite nicely!
 
I'm not sure if this adds anything extra to the thread, but I rotated the implicit equation by 45°. Doing this shows that the (previously) 3rd quadrant shape is certianly NOT an ellipse...

This is my "rotated" implicit equation:-
k*(x^2 - y^2) = 2 - sqrt(2)*(3*y^2*x + x^3)

and when k=10 it looks like this...

rotated.png

I think that the vertical asymptote to the "curved line on right" occurs at x=k/(3*sqrt(2)). Something tells me that it would not be easy to split these two shapes into two separate curve equations!
 
I've been trying to find a way to explain this by factoring. Here is the best I can do so far:

[MATH]x^3+3xy+y^3-1=0[/MATH] factors as [MATH](x+y-1)(x^2-xy+y^2+x+y+1)=0[/MATH]. The first factor explains the line; the second factor, if you solve it for y (using the quadratic formula) has discriminant [MATH]-3(x+1)^2[/MATH], so that the only real solution will be when [MATH]x=-1[/MATH]. This accounts for the isolated point.


Been playing with this second factor and tried completing the square..

[MATH](x+y-1)((x-(y-1)/2)^2+(3/4)(y+1)^2))=0[/MATH]

This second factor is only equal to zero when x=y=-1. Thanks for the suggesting the approach Dr P.
 
Been playing with this second factor and tried completing the square..

[MATH](x+y-1)((x-(y-1)/2)^2+(3/4)(y+1)^2))=0[/MATH]

This second factor is only equal to zero when x=y=-1. Thanks for the suggesting the approach Dr P.

From the two variables "equivalent" function, [math]z=f(x,y)[/math] , you can calculate the critical point (using vector calculus) and get it to be point [math](-1,-1,3)[/math] ,that is, the point [math]x=-1, y=-1[/math] when [math]k=3[/math] in the 2D graph (countour plot) "equivalent".
 
Here is the process I omitted yesterday (it is hard to write LaText for me. Many years ago I mastered it, but now ....)

[math] \text{Critical Points Conditions for } z=f(x,y) : \\ \\ \\\dfrac{\partial f}{\partial x}=0 \\\dfrac{\partial f}{\partial y}=0 \\ \\ \text{In our case: } \\ \\ z=f(x,y)=\left(\dfrac{1-x^3-y^3}{xy}\right) \\\dfrac{\partial f}{\partial x}=0 \Rightarrow -2x^3+y^3-1=0 \\\dfrac{\partial f}{\partial y}=0 \Rightarrow x^3-2y^3-1=0 \\\text{solving last two equatons we get: } x=-1, y=-1 \\\text{plugging these x and y in z equation we get: } z= 3 [/math]
From the graph it is clear it is a local minimum. I suppose ( I has not done it) it would be confirmed by the second derivative test...
 
So x^3+3xy+y^3=1 generates a straight line and an isolated point at (-1,-1)
I then explored

x^2+2xy+y^2=1

Without plotting it... i wander if anyone can work out what this will draw? It's less surprising now, but still caught me out initially.
 
This can be factorized to:

[math](x+y)^2=1 \\ x+y=\pm 1[/math]
So they are two straight lines equations:

[math]y=-x-1 \\y=-x+1[/math]
 
Similar with [math]x^2-2xy+y^2[/math] but the lines are rotated 90 degrees with respect to the positive equation.
 
Top