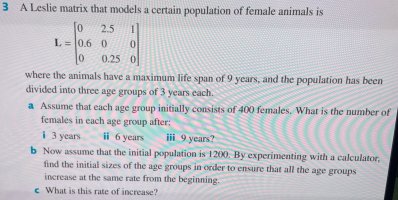
I am confused with part b and c of the problem below. I have only just started looking into eigenvalues and eigenvectors so some of my understanding may be incorrect
My thought process is, I should find the dominant eigenvalue for long term growth rate as the age groups can then follow this. I used the formula det(A-λI) = 0 and using laplace expansion found the eigenvalues to be -1.1712, -0.10068 and 1.2719, hence dominant would be 1.2719.
Subbing these back into the equation det(A-λI) = 0 to get the eigenvector, I ended up with three equations:
-1.271x + 2.5y + z = 0
0.6x-1.271y = 0
0.25y-1.271z = 0
which I manipulated to get an eigenvector representing ratio of (1, 0.472, 0.093). I then normalised this by dividing by the total, hence the proportions for each age group was
0.639 proportion or 767 0-3 year olds
0.301 proportion or 362 4-6 year olds
0.059 proportion or 71 7-9 year olds
I graphed this on simulator and it appears right as the population proportions remain constant.
But I don’t think I understand this still for part c is the rate of increase simply the eigenvalue??? Furthermore how would using a calculator for this problem be possible?