I have moved your question from the first subforum listed on the front page ("News") to a topic-appropriate category. In future, kindly please conform to what is explained in the "
Read Before Posting" announcement. Thank you for your consideration.
I need help in finding the local minimum. First i find the derivative of the given function f(x). Now i don't know how to find the local minimum and the area of between points on the graph.
I have attached my work. Please help in finding the minimum and area between the point f and x=0.
Which portion(s) is/are the exercise? Which is/are your work? What do you mean when you say that you "don't know how to find the local minimum and the area...between points on a graph" (by which I assume you mean "the area under a curve, between two given endpoints")? Are you saying that you are needing instruction in calculus techniques? Or that you don't know how to use the specified software? Or something else?
For other readers, the text in the graphics is:
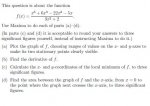
This question is about the function
. . . . .\(\displaystyle f(x)\, =\, \dfrac{x^5\, +\, 6x^3\, -\, 22x^2\, -\, 5x}{3x^2\, +\, 2}\)
Use Maxima to do each of parts (a) through (d).
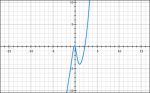
(a) Plot the graph of f, choosing ranges on the x- and y-axes to make its two stationary points clearly visible.
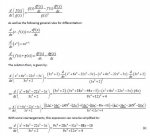
(b) Find the derivative of f.
(c) Calculate the x- and y-coordinates of the local minimum of f, to three significant figures.
(d) Find the area between the graph of f and the x-axis, from x = 0 to the point where the graph next crosses the x-axis, to three significant figures.
This is the poster's work (I
think):
(a)
(or view
here)
(b) \(\displaystyle \begin{align} \dfrac{d}{dx}\,\left(\, \dfrac{x^5\, +\, 6x^3\, -\, 22x^2\, -\, 5x}{3x^2\, +\, 2}\,\right)\, &=\, \dfrac{(3x^2\, +\, 2)\,\cdot\, \dfrac{d}{dx}\,(x^5\, +\, 6x^3\, -\, 22x^2\, -\, 5x)\, -\, \left(x^5\, +\, 6x^3\, -\, 22x^2\, -\, 5x\right)\,\cdot\,\dfrac{d}{dx}\, (3x^2\, +\, 2)}{(3x^2\, +\, 2)^2}
\\ \\ &=\, \dfrac{(3x^2\, +\, 2)\, (5x^4\, +\, 18x^2\, -\, 44x\, -\, 5)\, -\, (x^5\, +\, 6x^3\, -\, 22x^2\, -\, 5x)\, (6x)}{9x^4\, +\, 12x^2\, +\, 4}
\\ \\ &=\, \dfrac{(15x^6\, +\, 54x^4\, -\, 132x^3\, -\, 15x^2)\, +\, (10x^4\, +\, 36x^2\, -\, 88x\, -\, 10)\, -\, (6x^6\, +\, 36x^4\, -\, 132x^3\, -\, 30x^2)}{9x^4\, +\, 12x^2\, +\, 4}
\\ \\ &=\, \dfrac{9x^6\, +\, 28x^4\, +\, 51x^2\, -\, 88x\, -\, 10}{9x^4\, +\, 12x^2\, +\, 4}\end{align}\)

")