This may be of interest to those of you who have mutual funds.
I used the monthly gains or losses of my mutual fund to model how this investment would compare with a GIC. The idea was that on any given month, I can compare the interest rate of my mutual fund (as a function of annual compound interest) to the current GIC rates calculated on a per-annum basis.
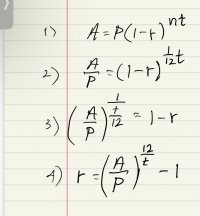
To do this, I used the standard Compound Interest Formula, with interest applied 1/12 times (n) per monthly time period (t). My original investment is (P), and (A) is the amount following each month. My math to capture this function is shown in the attached image.
Unlike a GST investment that has a constant interest rate, the gains and losses in mutual funds can fluctuate daily. However, I only receive data once a month.
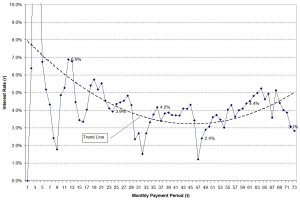
A six-year plot of interest rate (r) vs monthly payment period (t) shows large oscillations at the very beginning that quickly settle down. (see attached plot). I've also included a trend line for what it's worth.
Please let me know if my model is reasonable or if it is even correct, and if there may be a better way to do this.
Thank you.
I used the monthly gains or losses of my mutual fund to model how this investment would compare with a GIC. The idea was that on any given month, I can compare the interest rate of my mutual fund (as a function of annual compound interest) to the current GIC rates calculated on a per-annum basis.
To do this, I used the standard Compound Interest Formula, with interest applied 1/12 times (n) per monthly time period (t). My original investment is (P), and (A) is the amount following each month. My math to capture this function is shown in the attached image.
Unlike a GST investment that has a constant interest rate, the gains and losses in mutual funds can fluctuate daily. However, I only receive data once a month.
A six-year plot of interest rate (r) vs monthly payment period (t) shows large oscillations at the very beginning that quickly settle down. (see attached plot). I've also included a trend line for what it's worth.
Please let me know if my model is reasonable or if it is even correct, and if there may be a better way to do this.
Thank you.