Agent Smith
Full Member
- Joined
- Oct 18, 2023
- Messages
- 464
How do I change a nonlinear functiom to a linear function?
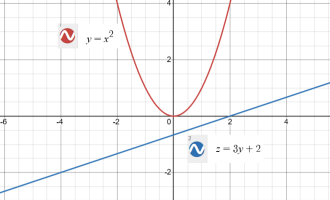
I'm given y=x2 (parabola/quadratic) and asked to convert it into a linear function.
Something to do with x2, but when I try to graph this (on desmos), I still get a parabola.
f(x)=x2 (parabola)
g(x)=3f(x)=3x2 (which I expected to be linear, because it looks like g(z)=3z), is not)
Gracias
I'm given y=x2 (parabola/quadratic) and asked to convert it into a linear function.
Something to do with x2, but when I try to graph this (on desmos), I still get a parabola.
f(x)=x2 (parabola)
g(x)=3f(x)=3x2 (which I expected to be linear, because it looks like g(z)=3z), is not)
Gracias