You are using an out of date browser. It may not display this or other websites correctly.
You should upgrade or use an alternative browser.
You should upgrade or use an alternative browser.
plot a function
- Thread starter CaliA
- Start date
D
Deleted member 4993
Guest
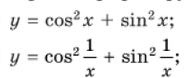
To plot a function, you should make a table of x vs y. Did you do that?Hello! i need to plot a function for second example!
If you can, with some explanation. Help someone, please...
Thanks!!!!
Do you realize that there is a 'hole' in the graph at x=0 ?
To plot a function, you should make a table of x vs y. Did you do that?
Do you realize that there is a 'home's in the graph at x=0 ?
yeah i did the table, and the domain is X≠ 0
Attachments
D
Deleted member 4993
Guest
where is the table?yeah i did the table, and the domain is X≠ 0