The Velociraptors
New member
- Joined
- Jul 16, 2020
- Messages
- 48
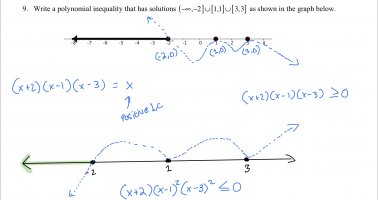
 I know that the inequality has to be less than or equal to 0 because that’s what the answer said. But I’m having trouble graphing this. Why is three and 1 included if the inequality is less than or equal to 0? They’re both greater than 0. Is it just the set of y values that must be less than 0, or both x and y values less than or equal to 0? If it was only y-values though, then it would be odd how the regions of 3 and 1 aren’t shaded making the domain (-infinity,3). I really don’t understand what is happening, if anyone has any resources or know of any videos that touch on this, that would be extremely helpful.