charlottecharlielee
New member
- Joined
- Nov 24, 2019
- Messages
- 4
Hi everyone,
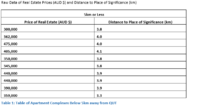
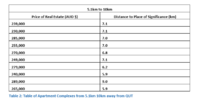
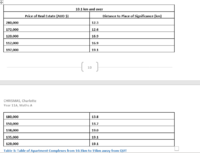
I'm having trouble understanding residual graphs and have been trying to work out this one graph for about an hour with no success. It would be great if someone told me what this graph actually means? The context is around the question: "Does the price of real estate depend on the proximity of their location to a place of significance?"
I also don't know what to title the axis, if anyone could help with that? Thank you so much.
The variables are the price of real estate (y) and the distance to the place of significance (x).