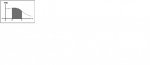
The graph is of a function R'(t) (0≤t≤10), where t=0 represents 2000. The graph shows the release rate expressed in prisoners per year from Tidewater Prison. What does the shaded area represent?
A) The average rate of release between 2002-2005.
B) ∫(5 for upper limit, 2 for lower limit) R'(t)dt
C) The number of prisoners release between 2002-2005
D) Both choices B and C.
Im almost sure its A, but not entirely.
A) The average rate of release between 2002-2005.
B) ∫(5 for upper limit, 2 for lower limit) R'(t)dt
C) The number of prisoners release between 2002-2005
D) Both choices B and C.
Im almost sure its A, but not entirely.